
Adwave resources
Insights & Trends · Page 3
Expert insights on TV, social, search, and multichannel advertising for small businesses. - Page 3
164 resources
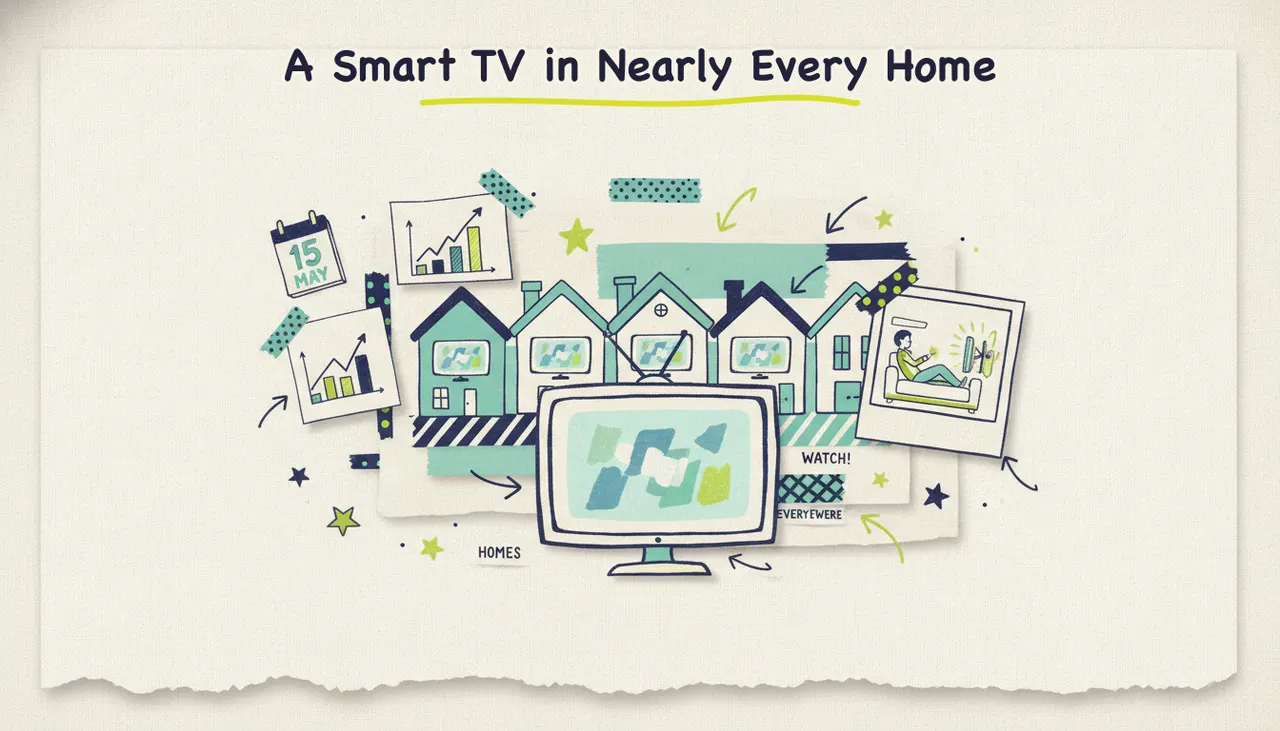
How many U.S. homes have a smart TV? (Q2 2026)
Roughly 90% of U.S. TV households now have a connected TV device and 243M+ Americans will watch CTV in 2026. What near-universal smart TV penetration means for small business ads.
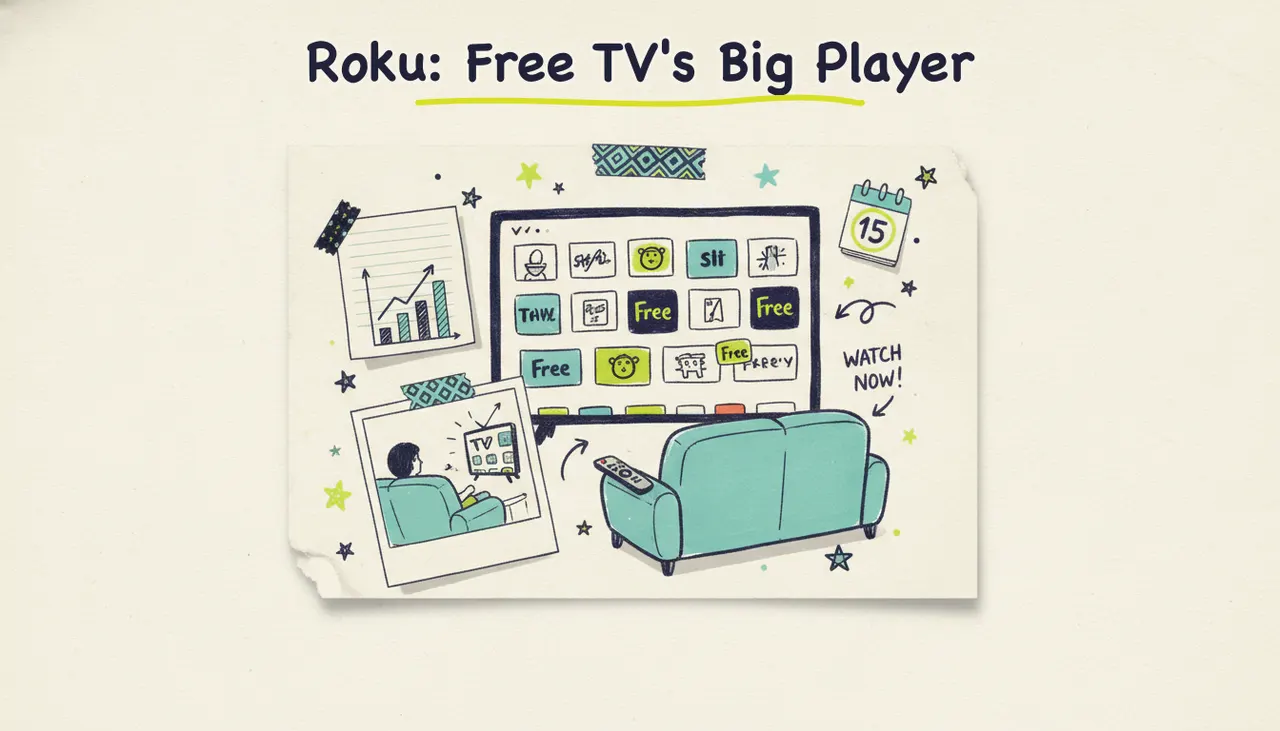
What is Roku's share of TV viewing? (Q2 2026)
The Roku Channel is a top-five streaming service at ~3% of U.S. TV viewing, while 21% of all TV runs through Roku devices. Why Roku is one of the most SMB-accessible CTV platforms.
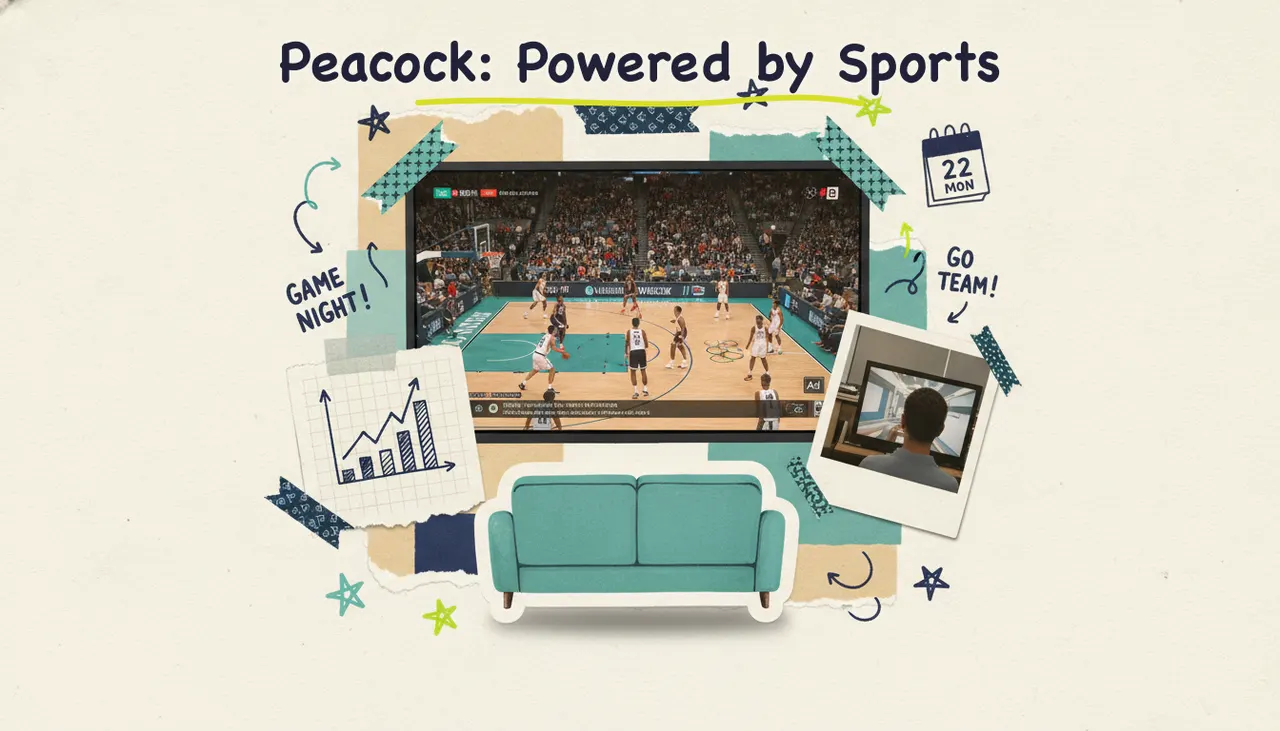
What is Peacock's share of TV viewing? (Q2 2026)
Peacock hit 1.2% of U.S. TV viewing in April 2026, spiking to 3.0% around the Super Bowl and Olympics. Its 46M subscribers, NBA deal, and what its ad-supported audience means fo...
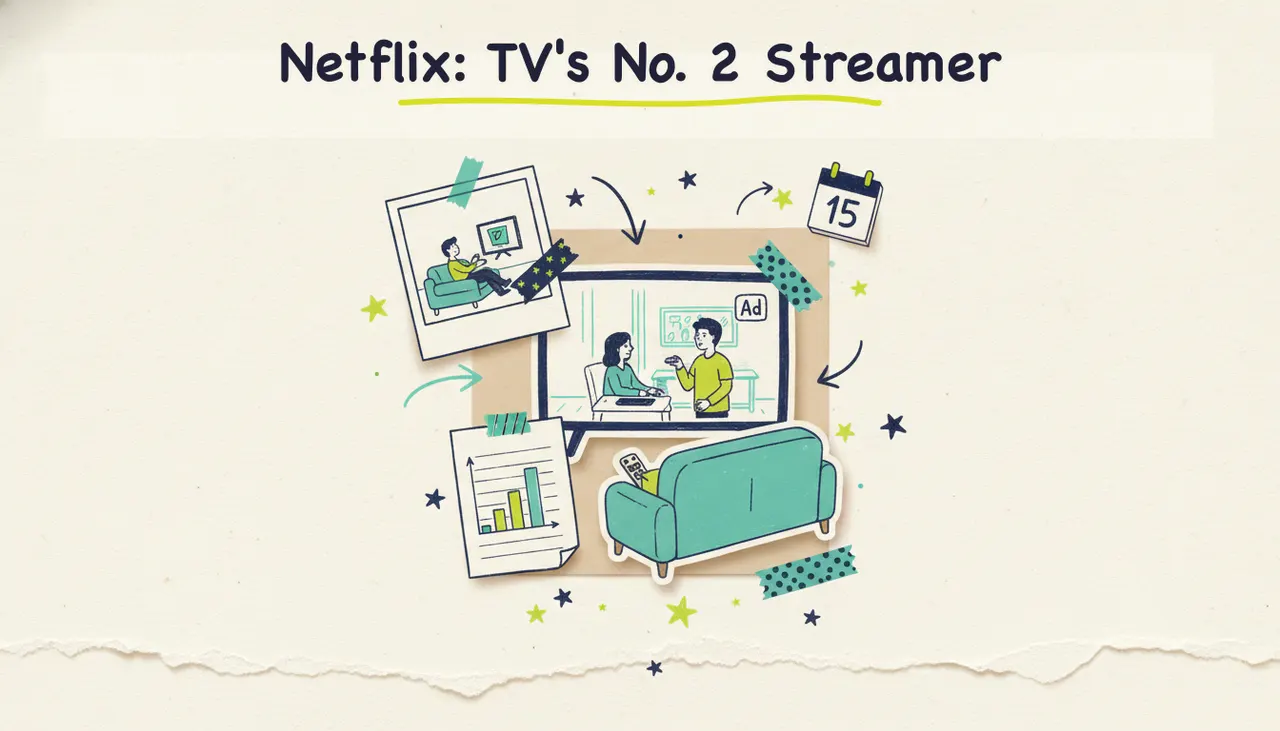
What is Netflix's share of TV viewing? (Q2 2026)
Netflix took 7.8% of U.S. TV viewing in April 2026, second only to YouTube, while its ad tier passed 250M viewers. The Q2 2026 breakdown for small business advertisers.
Which streaming service has the most viewers? (Q2 2026)
YouTube leads U.S. streaming at 13.4% of TV viewing in April 2026, ahead of Netflix at 7.8%. The full Q2 2026 ranking of the most-watched streaming services.
What is Hulu's share of TV viewing? (Q2 2026)
Nielsen now folds Hulu into Disney's ~5% combined streaming bucket; its last standalone reading was 2.5%. Hulu's ~64M subscribers and what its ad-supported audience means for SMBs.
What is Disney+'s share of TV viewing? (Q2 2026)
Disney is the #2 media company on U.S. TV at 10.3%, with combined streaming near 5%. The Q2 2026 breakdown and what Disney's ad-supported reach means for small business.

How big is the CTV advertising market? (Q2 2026)
The U.S. CTV ad market reaches nearly $38 billion in 2026, and 85% of small advertisers are now in. What the Q2 2026 numbers mean for small business advertising.
How many Americans have cut the cord? (Q2 2026)
Non-pay-TV households now outnumber pay-TV homes in 2026, with penetration down to ~42%. The Q2 2026 cord-cutting breakdown and what it means for local advertisers.
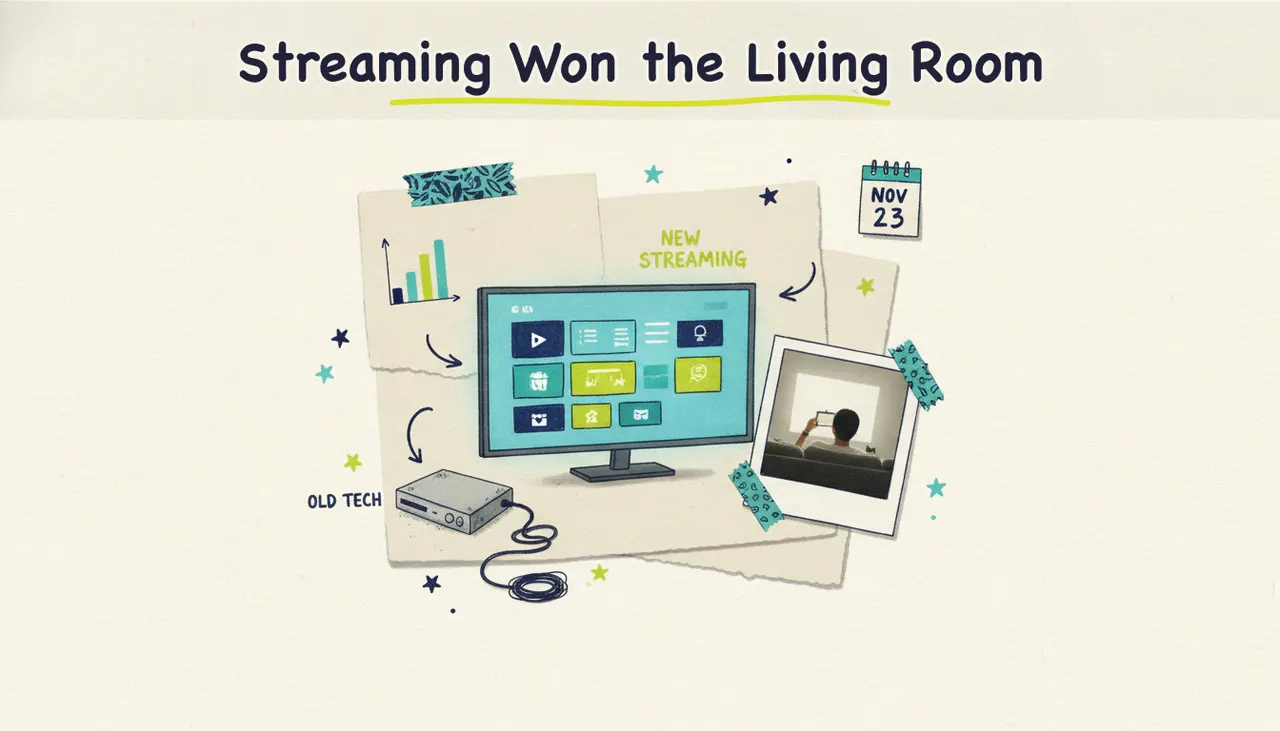
How much TV viewing is cable vs streaming? (Q2 2026)
Streaming took 47.6% of U.S. TV viewing in April 2026 to cable's 21.6%, a 26-point gap. The Q2 2026 Nielsen breakdown and what it means for where small businesses advertise.
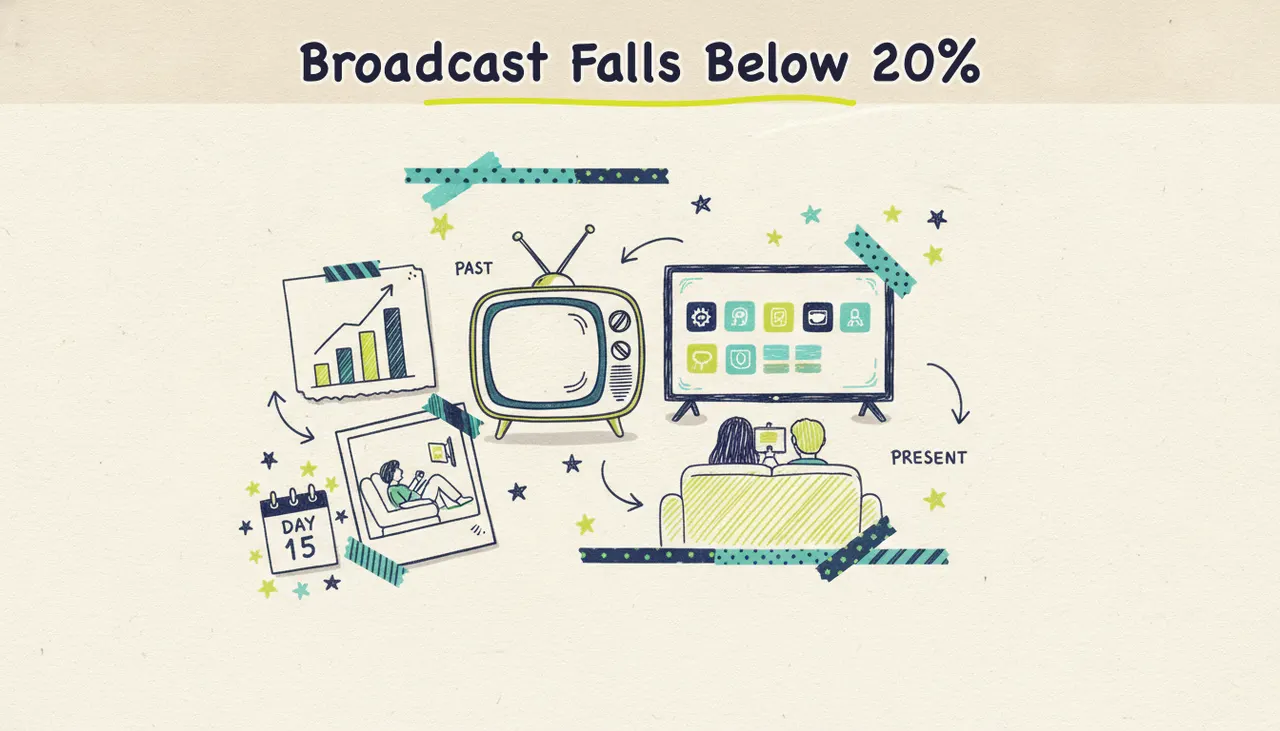
What percentage of TV is broadcast? (Q2 2026)
Broadcast TV dropped below 20% of U.S. viewing for the first time in April 2026, now the smallest traditional category. The Q2 2026 breakdown for local advertisers.
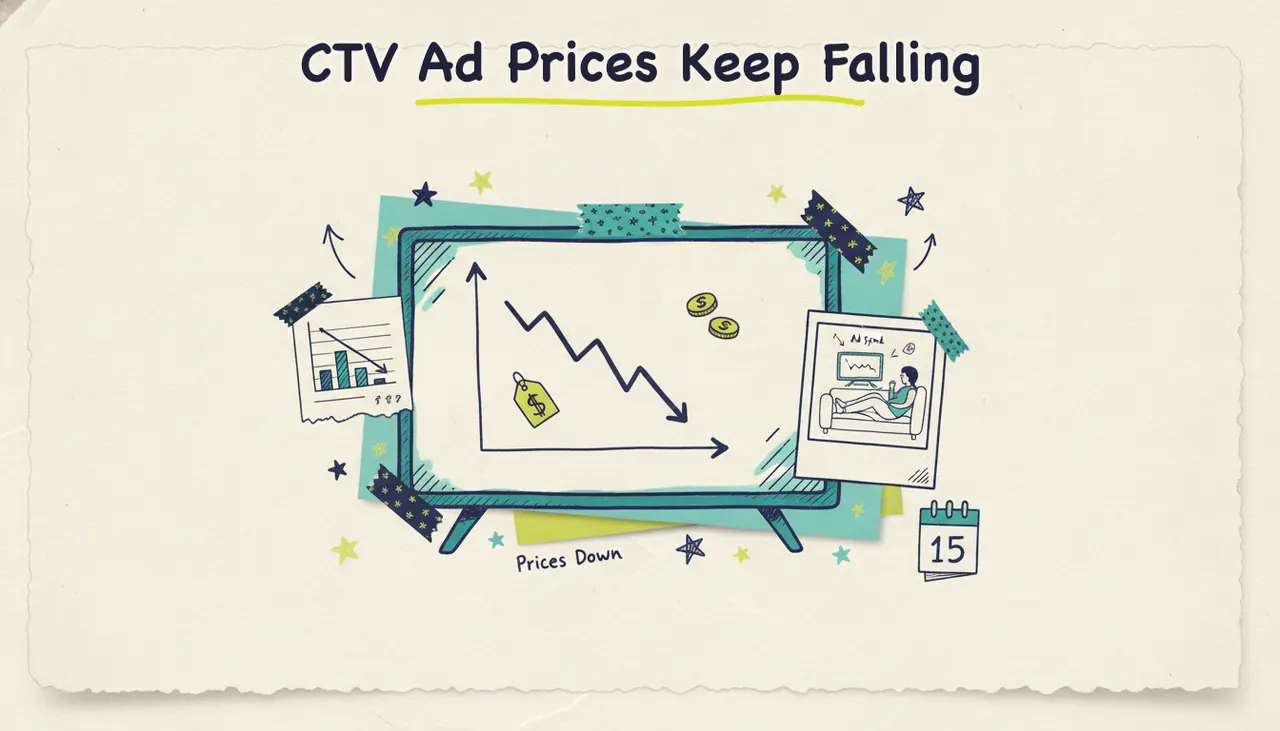
What is the average CTV CPM? (Q2 2026)
The blended CTV CPM is about $26 in 2026 and dropping as streaming inventory floods the market. What connected TV ads cost by tier and what a $500 budget buys.