A 5% relative lift at a 3% baseline requires far more traffic than a 20% lift. Henkan Partners’ sample-size estimates put the requirement at about 207,936 visitors per variant for a 5% lift, compared with about 13,911 for a 20% lift and 53,208 for a 10% lift. The common planning standard of 95% confidence and 80% power means an 80% chance of detecting a real difference at least as large as the effect you set out to find.
The decision is about conversions, not traffic alone. Run a randomized test only if each arm can collect enough conversions within a timeframe you can accept. If the required sample, divided by eligible weekly traffic per arm, exceeds about eight weeks, test a larger change, choose a higher-volume metric, or skip the randomized test.
How Much Traffic a Test Really Needs
At 2% conversion, detecting a 10% relative lift means distinguishing 2.0% from 2.2%. That requires about 78,000 visitors per variant, or roughly 157,000 total, under the assumptions used for the table below. At a 6.6% baseline, a 20% relative lift requires about 5,700 visitors per variant. The higher baseline needs fewer visitors for the larger lift.
| Baseline conversion rate | Relative lift to detect | Visitors needed | What it means |
|---|---|---|---|
| 3% | 20% | 13,911 per variant | Achievable for some small sites with steady traffic |
| 3% | 10% | 53,208 per variant | Often takes months at low volume |
| 3% | 5% | 207,936 per variant | Rarely feasible for a small business |
| 2.0% | 10% | About 78,000 per variant, or 157,000 total | Both arms combined |
| 6.6% | 20% | About 5,700 per variant | Higher baseline shortens the test |
| Any baseline | 20% | About 400 conversions per variant | Count conversions, not visitors |
A modest lift can require a large audience. The visitor requirement depends on four inputs: baseline conversion rate, minimum detectable effect (MDE), significance level, and power. The MDE is the smallest relative lift you are willing to treat as a success. Shrinking it from 20% to 5% sharply increases the required sample. Power does not mean the test will be right 80% of the time. It means that if the true lift is at least the MDE, the test has an 80% chance of detecting it.
Practical rule: Divide the per-arm visitor requirement by eligible weekly traffic for that arm. If the result exceeds about eight weeks, the idea may be too small, the metric too rare, or the randomized test may need to wait.
Plan around conversions per variant, not sessions. A page can draw a reasonable audience and still produce too few purchases for a timely test. If web traffic cannot support the decision, a measurable TV campaign can provide another way to assess advertising performance. A guide to measuring advertising effectiveness explains what that channel can show. Adwave lets small businesses run measurable TV placements while reserving scarce site traffic for a focused web test.
Choosing Goals and Changes That Can Win
A button-color test and an offer test spend the same visitors. Only one of them can move a small site enough to see.
Say a regional HVAC company gets about 1,200 visitors a month. Half go to each arm, so each arm sees about 600. A green button versus a blue one might be worth a few percent if it is worth anything. On this traffic that lift is invisible. The same split can compare a same-day service promise with the current seasonal discount, scored on booked estimates rather than form clicks. Booked estimates happen less often than clicks, but they are the commercial event, and the two promises are different enough that a real gap can show up.
When you only have about 100 to 500 conversions, a practical low-traffic framework from Conversion Works says aim at effects of roughly 30% or greater. Skip the 5% to 10% wording tweaks. Those hypotheses need far more observations than a local site will collect.
One bold arm, then less noise
Bundle related fixes into one treatment. A clearer promise, a shorter form, and proof next to the price can ship as a single variant against control. A third arm cuts every sample by another third. Pool comparable pages or funnel stages so the test gains volume, randomize the same way on each, and don’t mix audiences that buy for different reasons.
Two design choices cut noise without inventing certainty:
- CUPED: Adjust the outcome with correlated pre-experiment behavior so historical differences don’t masquerade as a lift.
- Stratified randomization: Keep device, geography, acquisition source, and business segment balanced across arms.
A Bayesian read can sit on top of that, as the probability that B beats control plus a predeclared expected-loss limit. It does not fix bad randomization, a novelty spike, or peeking.
Treat a small-sample “winner” as directional unless the effect is large, stable across segments, and replicated.
Pair the number with session recordings, interviews, and support-ticket themes. Keep a persistent holdout, typically 5% to 10%, so a post-launch drop is still visible. The same “one meaningful change, one frequent metric” habit applies off the website. A/B testing emails is a useful parallel when the list is small and the open is not the outcome you sell.
Prioritizing and Sequencing Low-Traffic Experiments
Rank ideas before any of them get traffic. Score expected effect, conversion volume, the cost of being wrong, and how easily you can undo the change. Set aside anything whose sample would outlast the weeks you can wait.
- List the funnel stages and the one conversion each stage feeds. A homepage, a service page, and a booking form are three tests, not one. You need that map first because a later score is meaningless if two ideas share an event.
- Score the largest friction ahead of cosmetic edits. Offer, audience, creative, landing-page message, and price outrank color and microcopy. They sit second because the queue should spend scarce conversions where a visitor hesitates.
- Run one experiment per stage at a time. A new headline and a new form in the same weeks make the result impossible to assign. This step is third so a winner at one stage isn’t an artifact of a change at the next.
- Queue the next test only after the current one hits its stop rule. Log the hypothesis, the observed effect, the decision, and the date in a few lines. The log is last because it stops the team from rerunning a dead idea under a new name.
A home-services firm with twenty candidate ideas should keep the three that could plausibly move cost per booked estimate by a large margin, then run them in order of reversibility rather than ease of build. A price test that is hard to unwind waits behind a message test you can revert in an hour.
Rejected ideas are not deleted. Store each one with the traffic it would need, and reopen it when volume grows.
Comparing Bayesian, Sequential and Pooled Tests
The method is not the decision. The predeclared rule is.
| Method | What it reports | When to stop | Main risk |
|---|---|---|---|
| Fixed-horizon frequentist | P-value and confidence interval | Only at the pre-set sample size | Early peeking inflates false positives |
| Sequential testing | Results against adjusted boundaries | When a boundary is crossed or the maximum date arrives | Boundaries must be set before launch |
| Bayesian | Probability B beats A and expected loss | At a predefined threshold such as 95% probability | Still needs sample-size planning; poor randomization still biases results |
| Pooled test | One result across comparable pages or funnel stages | Same rule as the base method | Mixing different audiences distorts the comparison |
A fixed-horizon test is allowed to speak once, at the sample you set. Sequential testing lets you look early, but only against boundaries fixed before launch. Practitioner guidance claims sequential methods can shorten experiments by roughly 20% to 50%, and it still wants a minimum duration, a maximum stop date, and a threshold such as a 95% probability that one version is better. A 2025 academic paper on Bayesian A/B design makes the matching point for Bayesian work: controlling false-discovery rates and holding target power still requires explicit decision thresholds and sample-size planning.
What to report while the call is unclear
Don’t force a yes or no. Report four things: the probability of a meaningful lift, the plausible range of outcomes, the downside if the variant is wrong, and what another week of data is worth.
Refuse these shortcuts:
- Stopping on a spike: A lucky day is not a boundary.
- Changing the primary metric mid-test: The metric was part of the sample-size deal.
- Running many variants: Each extra arm starves the comparison.
- Shifting nearly all traffic to a provisional winner: That ends the test by stealth.
If the decision is reversible and the downside is small, act on a clear directional result. If it is costly, wait for the planned sample.
Membership sites face the same thin-signup problem. GolfRep’s approach to membership conversion optimisation is a concrete look at choosing offers and measuring them when you can’t afford a vague winner. For a creative test, the same rule is two materially different ads, a lead-quality or cost-per-qualified-lead metric set in advance, and a control audience that stays in place until the rule says stop.
Alternatives When Traffic Is Too Thin
Pick the method by the question, not by what the tool markets this quarter.
A randomized A/B test answers “which of these two experiences produces more of this event?” When you can’t fill that sample, the useful substitutes answer narrower questions: which combination, where to spend while you learn, why people hesitate, whether an early signal is worth a later revenue check, what happened in a matched market, and whether the launch got worse.
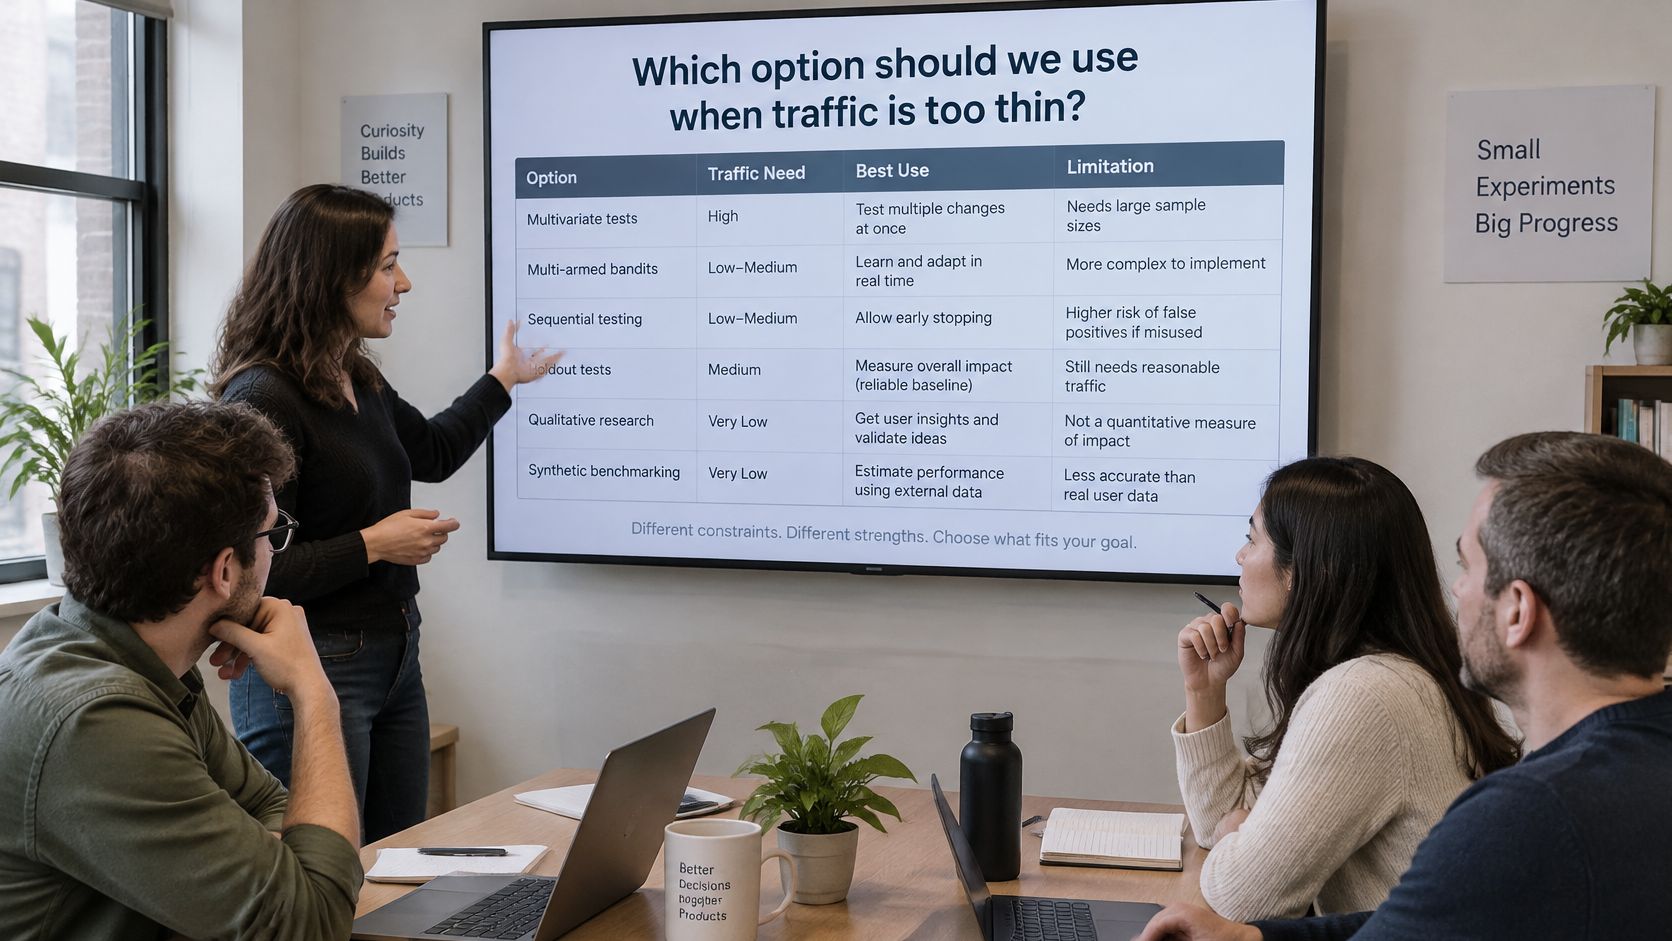
| Method | Traffic needed | Best use | Main limitation |
|---|---|---|---|
| Multivariate test | High, grows with every combination | Testing several elements on a large page | Splits traffic too thin for small sites |
| Multi-armed bandit | Moderate | Shifting spend toward a likely winner while running | Hard to measure a clean lift |
| Qualitative research | Usually 5-10 interviews plus recordings | Finding why visitors hesitate | Directional, not proof of size |
| Proxy-metric test | Uses frequent events such as form starts | Early signal when purchases are rare | Proxy may not match revenue |
| Geographic or pre/post comparison | Matched markets or time periods | TV and offline campaigns | Seasonality and outside events confound results |
| Persistent holdout | 5-10% of audience kept on the old version | Detecting post-launch regression | Small holdout gives noisy estimates |
A multivariate test multiplies combinations, so it is the wrong tool on a small site. A bandit is right when ongoing loss matters more than a clean lift estimate, and wrong when you need to know the size of the gap. Interviews, recordings, and ticket themes tell you why someone stalled. They don’t tell you how many bookings the fix will add. Customer feedback surveys help when you need that why before you spend a month of traffic.
A proxy such as form starts can move while revenue does not. Check it against money before you rebuild the page. A holdout left on the old experience is how you catch a post-launch drop the original test was too small to see. The estimate will be noisy. That is still better than shipping with no unchanged group at all.
Applying Low-Traffic Testing to TV and Ads
A local home-services firm has modest web traffic and two TV spots it believes in. One spot leads with a same-day arrival promise. The other leads with a seasonal price. Related proof points are bundled into each spot so the firm isn’t running four almost-identical cuts.
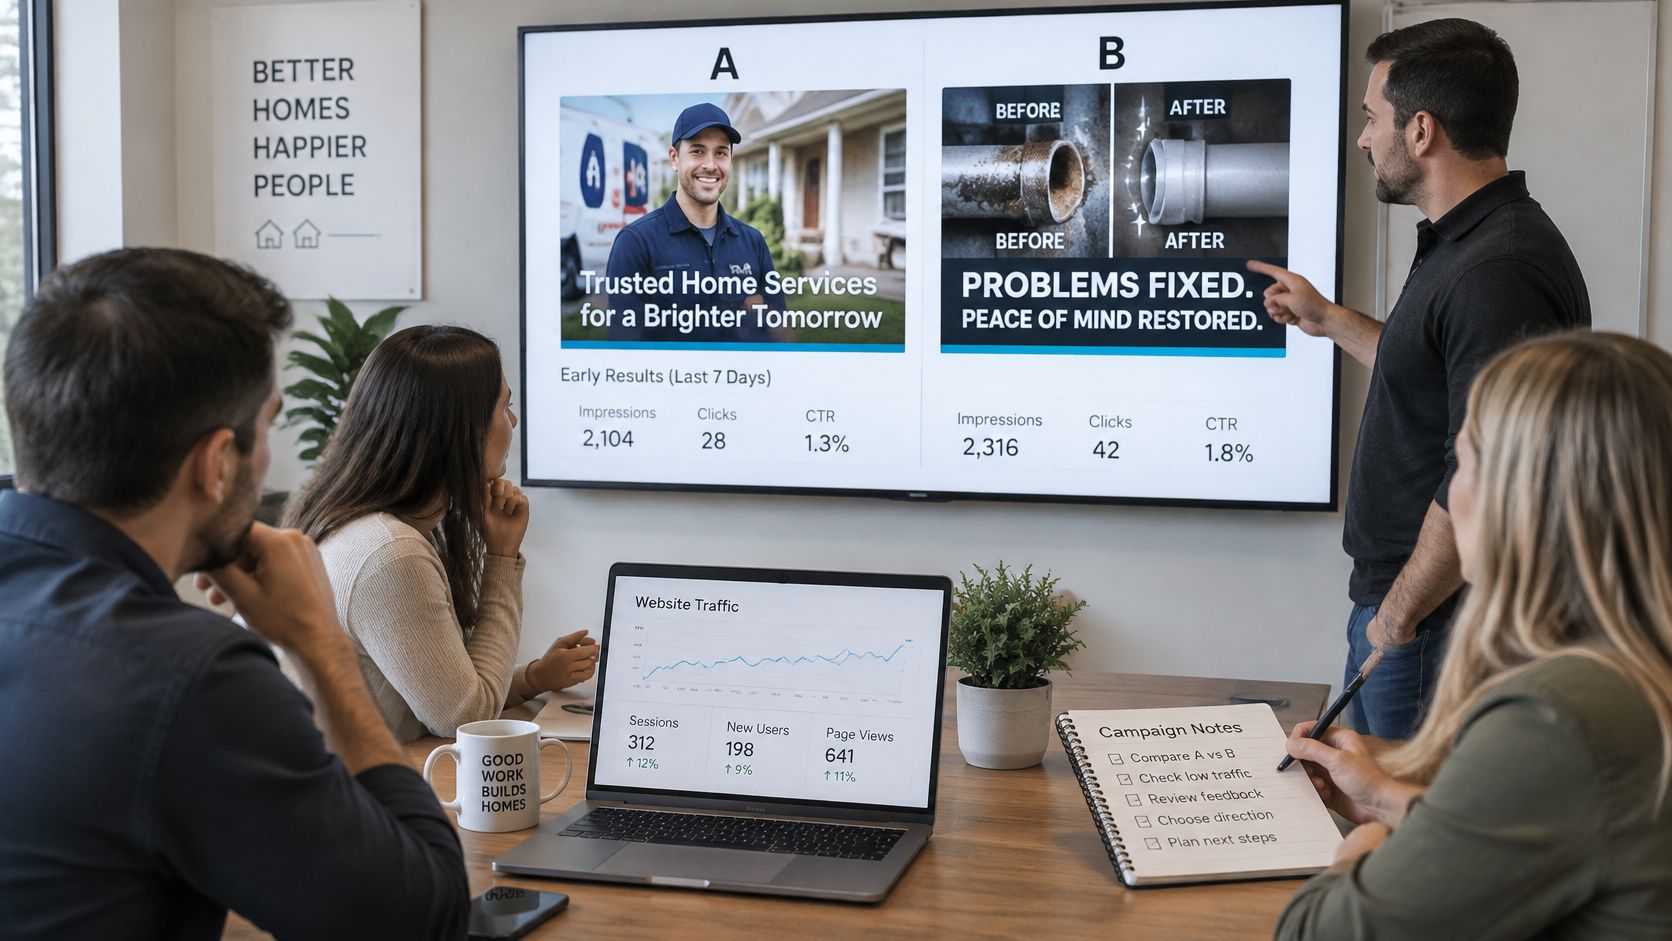
They don’t split a thin audience across three or four ads. NIST’s handbook on multiple comparisons describes procedures such as Bonferroni and Scheffé for simultaneous inferences, which is a reminder that extra arms demand extra evidence. A two-variant test already halves the data. The metric is booked estimates, or cost per qualified lead. Calls and clicks are noisier and easier to “win” without a job on the board.
Market A runs creative A. Market B runs creative B. The markets are matched on season and demand as closely as the firm can manage, and the read includes the time window, not just the creative name. A single TV test answers a creative question. It does not answer a website conversion question, so on-site measurement stays in place. TV ad analytics is how you keep that read tied to outcomes rather than to impressions alone.
Adwave fits this setup for a small budget. Its AI builds a broadcast-ready spot from a website URL, places it across more than 100 channels, starts at $50 with automatic pacing, and tracks performance in real time. Check which targeting options the plan includes before launch, and keep a control audience so the comparison stays interpretable. The single-campaign workflow keeps the media simple while the website’s scarce visits stay on one control-versus-treatment test.
Plan Test Duration and Lock Your First Test
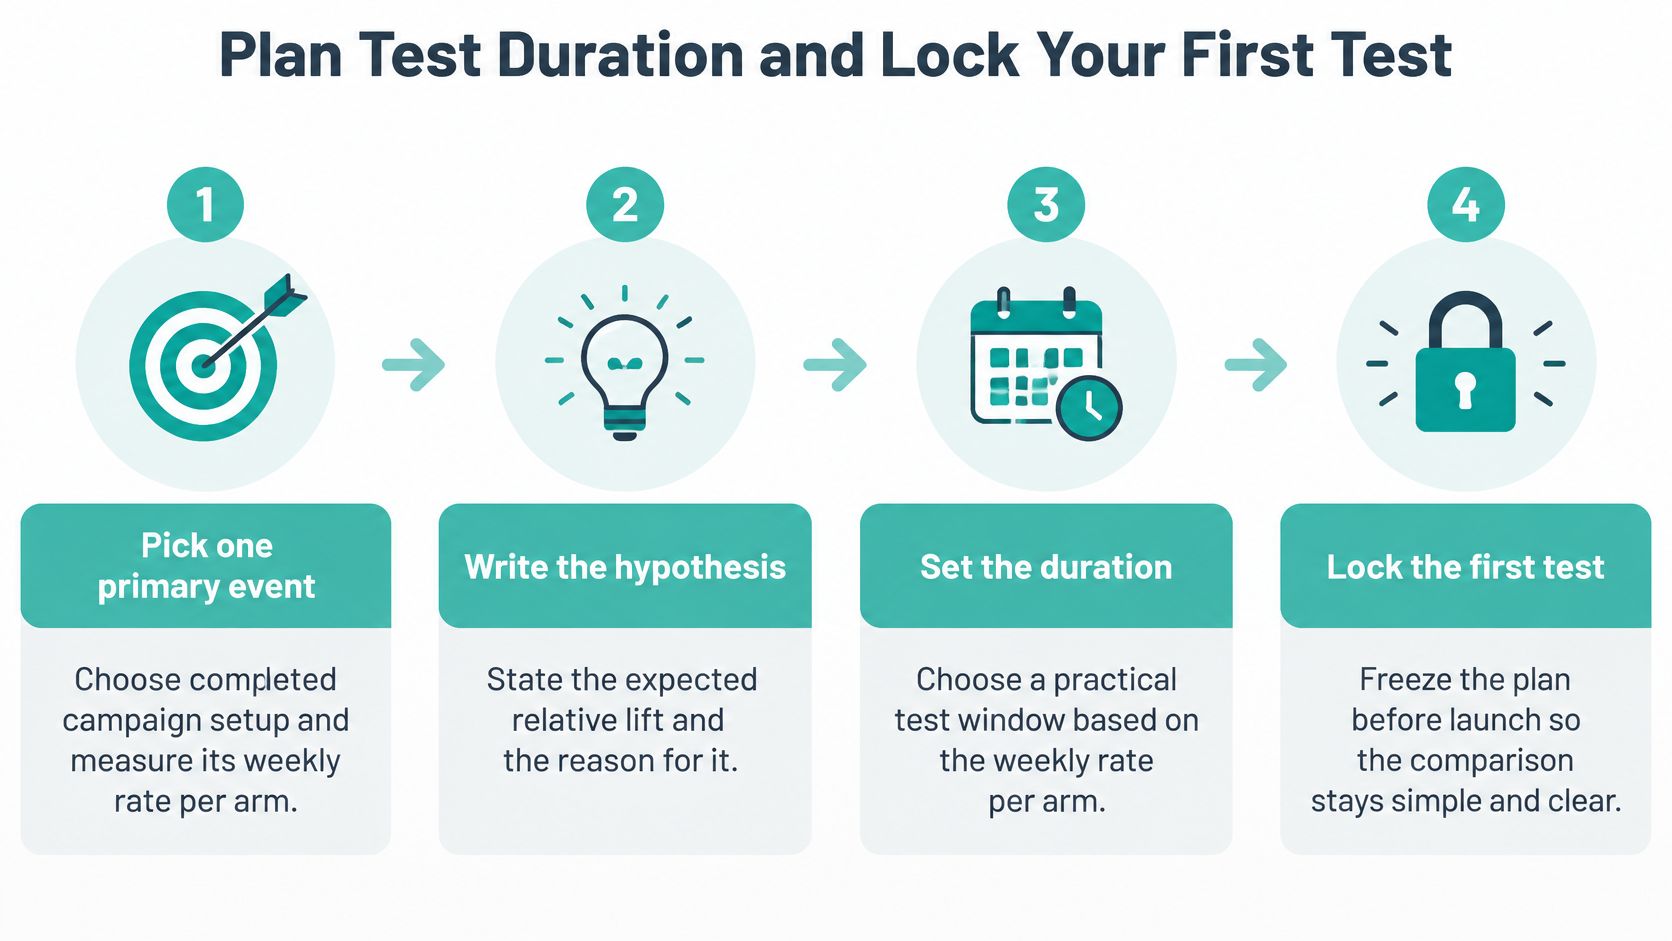
Lock the plan before the first visitor is assigned. Humblytics is explicit that detecting a 20% relative lift at 95% significance and 80% power can take approximately 400 conversions per variant, because conversions, not raw visitors, drive the wait.
- Pick one primary event and write the hypothesis. Completed campaign setup, booked estimates, or another downstream event with real volume beats a rare purchase. State the expected relative lift and why you believe it. The common slip is planning from visitors when conversions are the constraint.
- Set the MDE, 95% significance, and 80% power. A conventional design uses 80% power and a 5% two-sided error threshold. Read visitors and conversions per variant before you promise a two-week test. The slip is choosing an MDE you hope for rather than one you can detect.
- Run the quick check. Visitors per variant is about 16 × p × (1 − p) ÷ (absolute lift)², where p is the baseline rate. A 3% baseline and a 20% relative lift is an absolute lift of 0.006, so 16 × 0.03 × 0.97 ÷ 0.006² is roughly 12,900, near the 13,911 table value. Use it to sanity-check a calculator, not to replace one.
- Turn the sample into weeks and add a full business cycle. Divide by eligible weekly traffic per arm. Splitting traffic in half doubles each arm’s wait. Ending on a favorable spike is the slip here. If you must look often, use sequential boundaries set in advance. Unadjusted peeking inflates false positives.
- Name a guardrail, randomize, and pre-register. A refund rate or lead-quality rate can veto a “winning” conversion lift. Randomize at user or account level, check that assignment is balanced, analyze by intention-to-treat, and write the stop date and the decision rule where the team can see them.
- Add interviews and a holdout before launch. Five to ten interviews or recordings explain hesitation the rate will not. A 5% to 10% holdout stays on the old experience so a regression after launch is still detectable.
For a site test, one major change is enough. A clearer “launch campaign” call to action, or a simpler creative-generation flow, measured on completed campaign setup, beats five UI variants aimed at a rare purchase.
If the cheapest commercial signal is a TV or ad comparison rather than another month of thin web traffic, start there against the same pre-registered rule. Adwave can run that first matched-market comparison from a $50 starting budget, with pacing so spend stays inside the cap you set.
A/B testing on a small site fails when the sample is a wish. Adwave gives local advertisers a practical way to test two distinct TV creatives, track results in real time, and keep a control audience, starting at $50 across 100+ channels. If your next decision is a creative test rather than another underpowered button test, visit Adwave and set the rule before you spend.