Most buyers don’t wait for your feature tour to decide whether you’re affordable. They go looking for the bill, test it against a budget they already have, and leave if they have to work to reconstruct it. Good pricing page design treats that moment as a spend-comprehension problem, not a layout exercise.
Why Buyers Open the Pricing Page First
In 2024, 57% of SaaS visitors checked the pricing page before reading the product description, a figure attributed to InfluenceFlow’s 2024 Pricing Strategy Report in a roundup of pricing table examples. That order matters. For most visitors, this screen forms the offer before your feature copy gets a chance to.
Say a bakery owner opens your page between payroll and a flour order. She’s not scoring feature rows like a procurement team. She’s asking whether this month’s spend is survivable, what it buys, and how she stops it if sales dip.
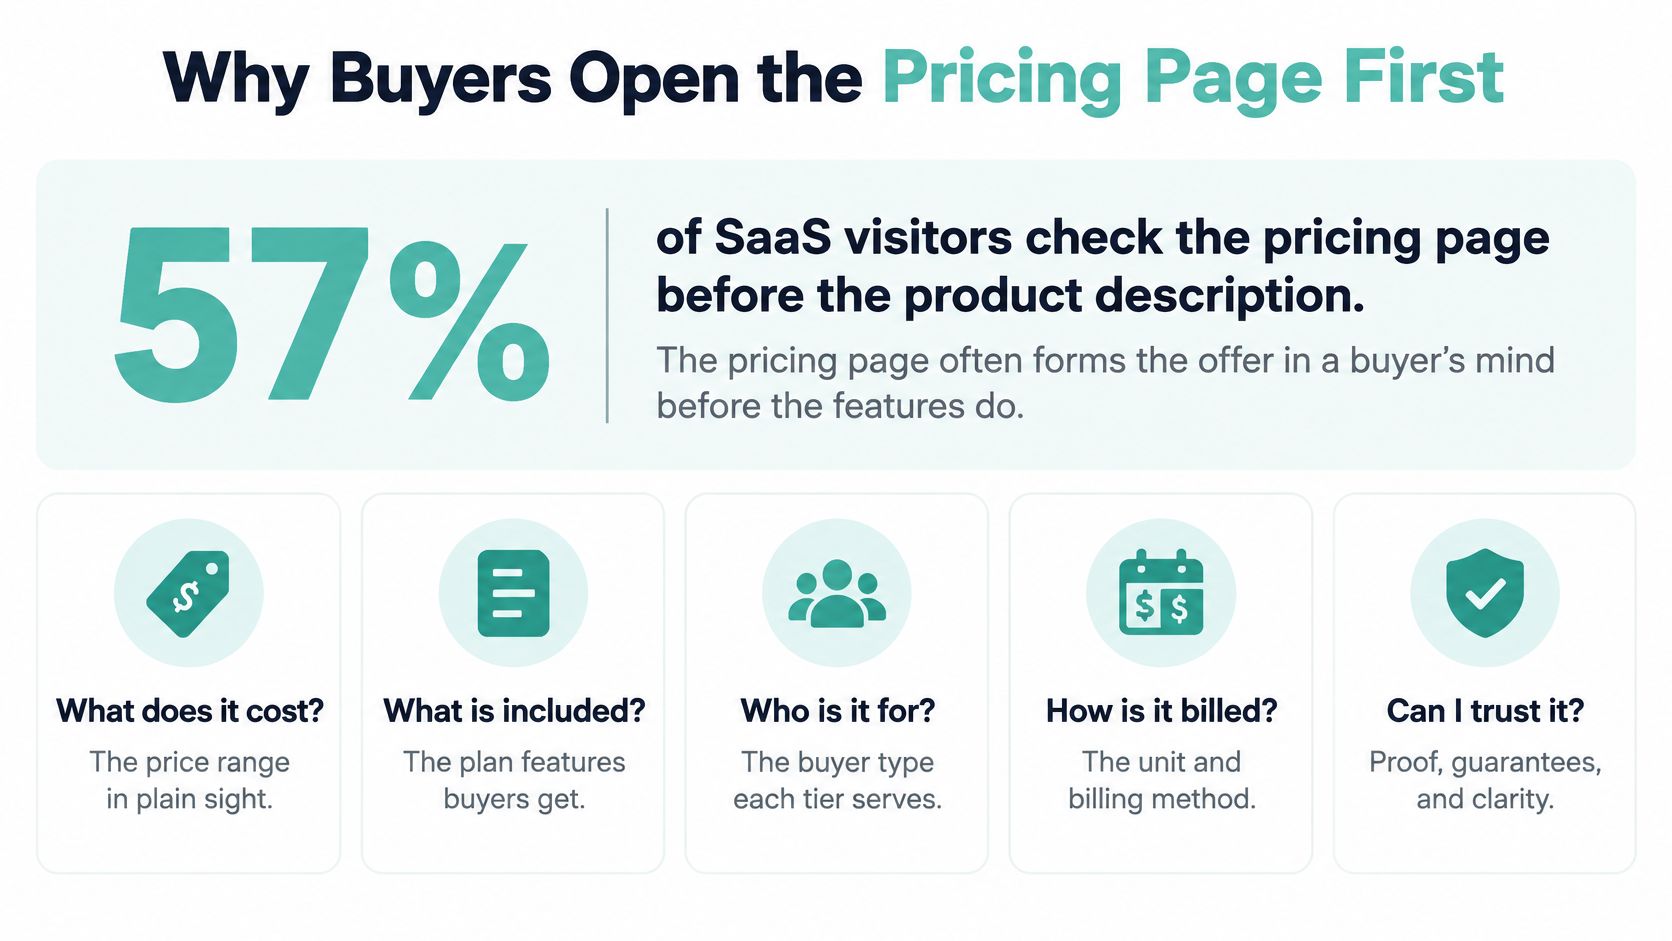
Five Answers the First Screen Must Give
- Starting price: The actual entry point, clearly visible, not hidden behind a demo form.
- Billing interval: Per month, per location, per user, or as a media budget, stated in words under the number.
- What that amount buys: Included usage, reach, seats, or deliverables tied to that specific price.
- Hard limits or fees: Caps, overages, production charges, taxes, or add-on costs that change the total.
- How cost changes: What happens to the bill if usage, locations, or scope grow.
Miss any one of those and a polished three-column grid still fails. It forces a second click for add-ons, a hunt for overage rules, or a sales call just to learn whether the buyer fits. That’s uncertainty at the exact point where confidence decides the click.
Practical rule: If a buyer can’t repeat your starting price, billing unit, and spending cap after one screen, you don’t have a pricing page yet. You have a teaser.
Pages that answer those five questions clearly tend to share a structure. If you want a useful comparison point for how a service presents tiered protection plans, you can explore chargeback alert plans from Disputely and note how much work the page asks of a first-time visitor. The standard is the same in any category: a normal buyer self-qualifies, and only genuinely custom needs go to a conversation.
What follows gives you that working standard. You’ll get a layout pattern to copy, headline and trust rules, spend scenarios for local advertisers with a public entry price, a build order, and the few metrics that show whether visitors understood the offer.
Layout Patterns Worth Copying
Pick your pattern before you argue about colors or copy. The table below puts the common choices side by side so you can mark one row as the page you’ll build.
Pricing page layout patterns and when they win
| Pattern | Best for | Evidence | Watch-out |
|---|---|---|---|
| Three core tiers | Most self-serve offers | 82% of 100+ SaaS pages; 68% of a 200-page set; about 14% better conversion than four or more tiers | Extra tiers raise bounce and stall the choice |
| Highlighted middle tier | One plan you want most buyers to take | 23 to 35% higher conversion to that tier vs an unhighlighted layout | Highlight without a who-it-fits line feels arbitrary |
| Most Popular badge | A middle tier that needs a single cue | About 17% more middle-tier selection from the badge alone | Badging every column, or the wrong column, trains distrust |
| Outcome groups of 3 to 5 features | Comparing value without a spreadsheet | Lower bounce than matrices of 40 or more rows | Still fails if limits, fees, and upgrades are missing |
| Starting price plus scenarios or calculator | Usage, media, or custom-leaning offers | Makes budget fit legible when a single fee would mislead | A low teaser price with the real bill postponed |
Three Tiers Is the Default for a Reason
A review of more than 100 SaaS pricing pages found that 82% used three pricing tiers. A separate analysis of 200 SaaS pricing pages found three-tier structures on 68% of sites, and pages with three tiers converted 14% better than pages with four or more tiers.
Three is enough to show a starting point, a recommended middle, and a step up for heavier needs. A fourth or fifth tier usually exists because internal teams couldn’t agree what to cut. Your visitor pays for that disagreement with a harder decision.
For a local advertising offer, that structure maps cleanly to Starter, Growth, and Scale. Adwave fits this pattern well, since an accessible entry point, a growth-oriented campaign option, and a higher-budget plan let small businesses compare without losing sight of AI-generated ads, audience targeting, launch tools, and performance tracking.
Highlight the Middle on Purpose
The same review of more than 100 pages linked above reported that companies with a highlighted middle tier saw 23 to 35% higher conversion to that tier than companies using an unhighlighted three-column layout, and a Most Popular badge alone increased middle-tier selection by 17%. Visual emphasis works because it answers the question most buyers bring: which one do people like me take?
The badge fails when it’s the only guidance. Pair it with one line that names who the plan fits and what outcome it serves, such as a single-location shop running its first steady campaign. Without that line, the highlight reads as a sales trick, and skeptical buyers route around it.
Group by Outcome, Not by Checklist
Exhaustive comparison matrices work against you. That 200-page analysis tied matrices of 40 or more rows to the highest bounce rates, while outcome-focused categories with three to five features per category performed better.
- Reach: Audience size, channels, or locations covered.
- Measurement: Reporting depth and how often results update.
- Support: Creative help, onboarding, and response level.
- Scale: Budget range, usage ceiling, and the cost of the next step up.
Buyers compare outcomes in seconds. They compare forty checkmarks never. Keep the full technical matrix, if you need one, below the main grid or behind an expandable detail view, and let the primary cards carry the decision. The same discipline that helps here applies across your funnel, which is why it pairs well with strong landing page practices that lift conversions.
When Price Varies, Show Scenarios
Usage-based and media pricing can’t hide behind one flat number. Pair a real starting price with a calculator or worked scenarios so buyers see what a given budget buys. A headline price alone invites the worst outcome: the buyer assumes the cheap case, discovers actual charges at checkout, and leaves distrusting everything else you said.
Treat every lift in this section as directional, not guaranteed. These samples are observational, not controlled experiments, so they tell you where to start testing, not what you’ll earn. Lock one row from the table as your pattern, build that page, and measure it against your own traffic.
Headlines Anchors and Trust Cues
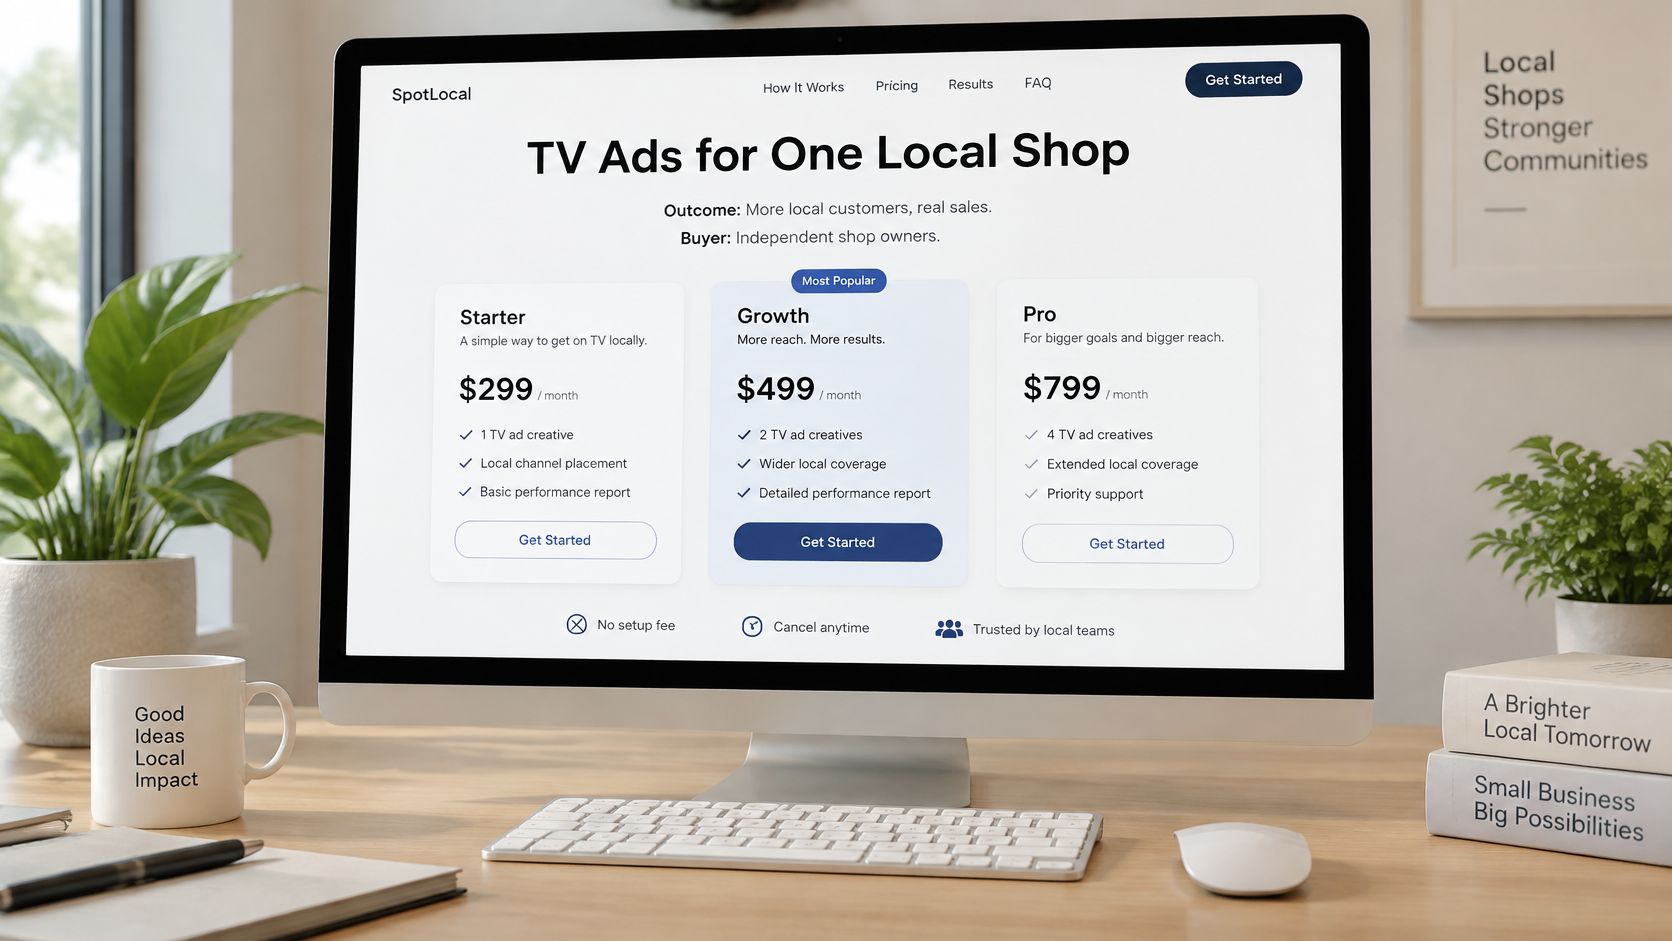
Layout decides where things sit. Language decides whether anyone believes them. Start with a headline that names the outcome and the buyer, such as TV ads for one local shop, instead of a slogan about growth. A founder scanning at speed should know in one line whether this page is for her business.
Under each price, state the unit in words. Write per month, per location, or media budget directly beneath the number, and express annual savings as dollars kept, not just a toggle position. If you need a refresher on writing that kind of direct copy, this guide to website copy that converts visitors into customers covers the plain-language basics.
Anchor Honestly and Write CTAs That Match Reality
A price anchor should clarify scope, not manufacture a decoy. Show the smaller starting commitment beside the recommended plan so the step up reads as more reach, more support, or more locations. When the jump buys something concrete, buyers accept it. When it buys nothing they can name, they assume margin padding.
CTA copy should state the next action and match how buying works. Start a $50 test fits a self-serve checkout. Book a custom plan fits a sales path. A vague Get Started button that dumps self-serve buyers into a demo form breaks the promise the page just made.
The Short Trust Block Every Page Needs
- Spend control: The cap, budget ceiling, or automatic pacing rule that stops overspend.
- What’s included: Production, setup, or onboarding covered by the stated price.
- Exit terms: Cancellation and refund rules in one sentence each.
- Extra charges: Taxes or fees that sit outside the headline price.
- Metric definitions: One plain line for any term like CPM before you ask buyers to compare on it.
Figma’s pricing page best practices emphasize stating whether a charge is monthly, per user, or per unit, and making annual savings explicit rather than relying on ambiguous toggles. That guidance points at a gap most conversion advice skips: whether people can understand the offer across devices, abilities, currencies, and buying roles.
A visually simple page can still conceal operational risk if the buyer can’t see total spend and how to stop it.
Accessibility and Mobile Are Conversion Work
Treat comprehension as an accessibility requirement, not polish. Set keyboard order so focus hits price, then CTA. Keep contrast strong enough that the recommended tier stays readable, use real table headers so screen readers can move through comparisons, and state the currency so an international buyer isn’t guessing at conversion.
On mobile, stack tiers with the recommended plan first. Convert comparison rows into short labeled pairs, and never hide fees behind an info icon that thumb users won’t tap. Small business owners often compare your price against payroll and inventory on a phone, so the total commitment has to survive the smallest screen you support.
For visual hierarchy, make the recommended tier the strongest contrast point on the grid, with one accent color reserved for that plan alone. Set the price as the largest type on each card, the billing unit smaller beneath it, and features quieter still. Place the single primary CTA directly under the price rather than at the card’s bottom, and keep enough whitespace between tiers that the eye reads left to right in price order.
Spend Scenarios for Local Advertisers
Seat pricing is easy to picture. Media pricing isn’t, which is why local advertisers need worked examples instead of a rate card. Connected TV is usually priced as CPM, cost per thousand impressions, not a flat fee per spot, so the same budget buys different reach depending on audience and placement.
One published small-business benchmark in Adwave’s guide to small-business TV ad spending places local CTV inventory around $15-$35 CPM, with premium sports, news, and tightly targeted placements reaching approximately $30-$45 CPM. At a $25 CPM, a $1,000 media budget buys about 40,000 impressions, while at $35 CPM it buys about 28,600.
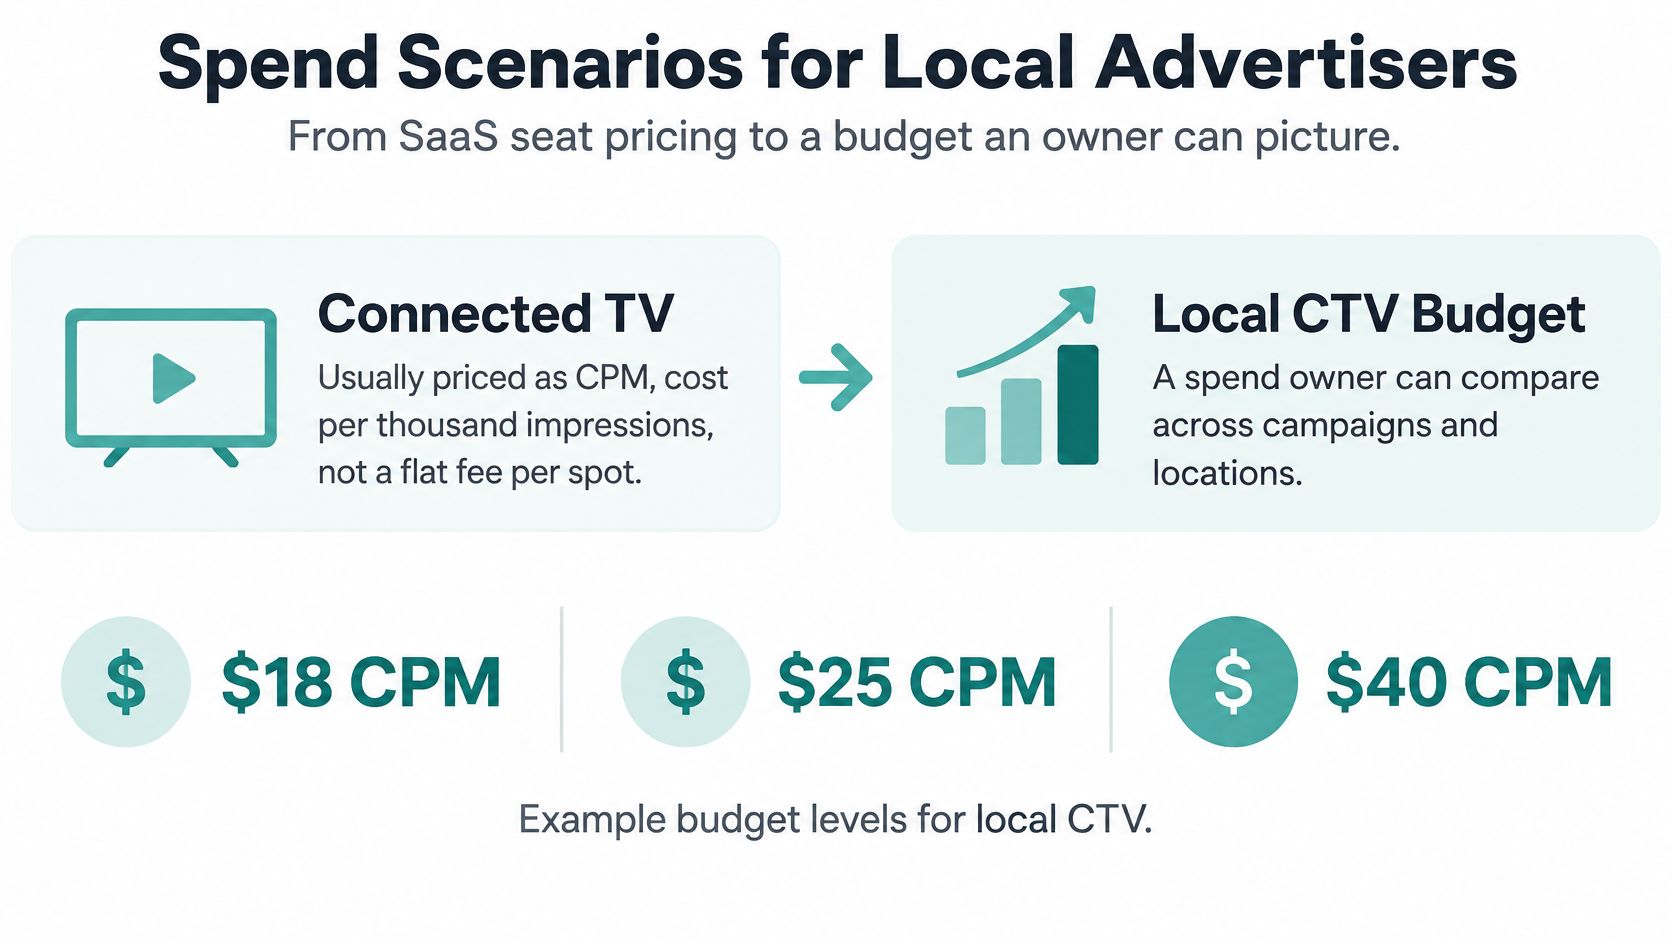
Local TV budget examples at common CPMs
| Scenario | Example budget | CPM used | Impressions illustrated | What the page should say |
|---|---|---|---|---|
| First test | $50 starting campaign | $15-$35 estimated | Show the range across that band | Entry price, spend cap, and what the test includes |
| Regional flight | $1,000 media | $25 midpoint | About 40,000 | Budget, impression example, and that delivery varies |
| Tighter or premium placements | $1,000 media | $35 | About 28,600 | Why sports, news, or tight targets cost more |
| Premium ceiling check | Same $1,000 | About $30-$45 | Fewer than the $25 case | When to expect the high end of the range |
Three Scenario Cards Worth Publishing
Test campaign. A single-location shop starts at the $50 minimum, with pacing that won’t pass the set cap, to learn whether TV creative and local reach justify a larger flight. The card’s job is risk removal: small entry, hard ceiling, clear learning goal.
Regional campaign. A restaurant or clinic sets a few hundred dollars up to about $1,000 and reads the impression range at realistic CPMs. Publish the range, not a vanity reach number, and say plainly that delivery moves with audience and inventory. Owners trust a range they can plan around more than a precise figure that later misses.
Multi-location campaign. A dealer group or brokerage compares a higher budget tier by locations covered, reporting depth, and service level. At this level the differentiator isn’t impressions alone. It’s whether one buy can be managed, measured, and adjusted across every location without separate negotiations.
Why a Transparent Entry Point Wins Here
Adwave is a strong fit for this kind of page because the numbers sit next to the mechanics. Campaigns start at $50 with estimated CPMs of $15-$35, a website URL generates a broadcast-ready spot, and placement spans 100+ channels including NBC, Hulu, and ESPN. A local owner can connect budget, creative, and reach in one view instead of assembling the offer from three sales calls.
If you’re costing out your own first flight, this breakdown of how much it costs to advertise helps you sanity-check a budget before you commit. Publish at least one worked example on your own page, even if larger plans stay custom above a threshold. One honest scenario does more qualifying work than a page of feature claims.
Build Ship and Measure the Page
Build in this order and you’ll avoid the usual failure mode, where design finishes before anyone decides what the plans really are. Each step removes a specific source of buyer uncertainty.
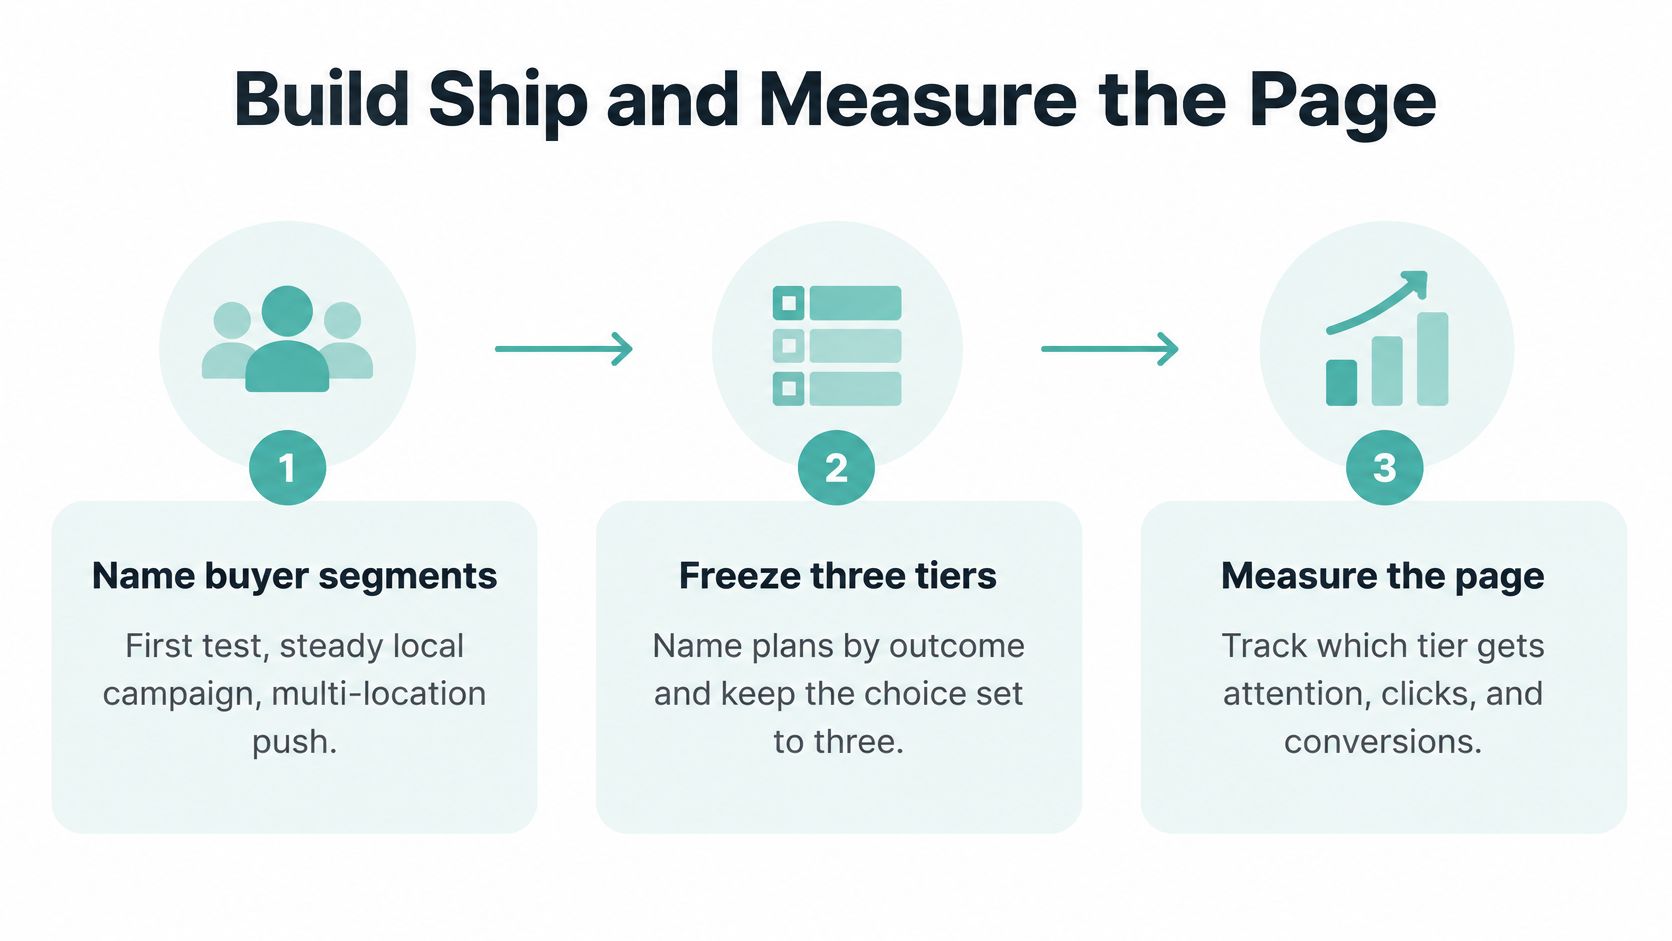
The Build Order
- Name two or three buyer segments. Define the job each plan supports, such as a first test, a steady local campaign, and a multi-location push. If a segment can’t describe its job in one sentence, it doesn’t get a tier.
- Freeze the choice set at three tiers. Name them by outcome or maturity level, not internal package codes. Buyers should self-sort by reading the names alone.
- Expose the money early. Put starting price, billing interval, included usage, limits, fees, and the cost of the next step up on the first screen. Anything that changes the total belongs where the price is, not at checkout.
- Group capabilities into value categories. Use three to five groups like reach, measurement, support, and scale, with a handful of real differences in each. Cut any row that reads the same across all three tiers.
- Mark one recommended tier. Add one line stating who it fits and the business result it serves. The highlight earns its place only when that line makes the choice feel obvious to the right buyer.
- Add escape hatches in plain view. Show a monthly or annual toggle with savings stated in dollars, a custom path only for buyers who need it, and one primary CTA per tier. Two competing buttons per card split intent and depress both.
- Draft mobile at the same time. Price, interval, and CTA must stay above the fold on a phone. If the mobile version is an afterthought, it’s where your fees and units will disappear.
Ship gate: Don’t launch until five target buyers can each state your starting price, billing unit, which plan fits them, and how they’d cap or cancel spend. One failure means the page isn’t understood yet.
Run that test with realistic tasks, not opinions. Ask each person to find the total cost for their situation, identify any extra fees, and pick a plan while thinking aloud. Fix comprehension problems before you touch colors, because a prettier page that still hides the bill converts the same confused traffic.
What to Measure After Launch
Pricing page metrics worth watching
| Metric | How to read it | 2024 reference | Act when |
|---|---|---|---|
| Pricing-page conversion | Checkout starts or qualified leads divided by pricing sessions | Average 3.5%; top quartile above 8% | You’re well under the average after traffic is real |
| Recommended-tier share | Share of plan choices landing on the highlighted tier | No published band; track your own baseline | Almost nobody picks it, or almost nobody picks anything else |
| Custom or contact share | Share leaving for a sales path | No published band; track your own baseline | Standard buyers can’t self-qualify |
| Mobile versus desktop conversion | Same definition, split by device | No published band; track your own baseline | Mobile price, unit, or CTA is hard to find |
| Comprehension task pass | Share who can state price, unit, fit, and cap | All five testers before launch | Any tester can’t explain the bill |
For context, an analysis citing ProfitWell’s 2024 SaaS Benchmarks reported that in 2024 the average SaaS pricing page conversion rate was 3.5%, while the top quartile exceeded 8%. Use that as a reference band, not a promise. A local services page with different traffic intent will land somewhere else, and that’s fine as long as your trend moves the right way.
Read the secondary metrics as diagnostics. A tiny recommended-tier share means your who-it-fits line isn’t landing. A swollen custom share means standard buyers can’t self-qualify and your tiers are missing a common case. A mobile gap almost always traces back to buried prices or CTAs pushed below long feature lists.
Change one thing per test and leave the three-tier structure alone until comprehension is solid. Test the headline, then the scenario example, then CTA wording, in that order of likely impact. If your traffic is thin, this guide to A/B testing with low traffic shows how to get usable reads without waiting months for significance.
The Local Version of Done
For a local advertiser, a finished page puts three facts in one view: the $50 entry, a $1,000 impression example, and the spend cap. That single screen answers what it costs to start, what a serious budget buys, and how the commitment stays controlled. Adwave offers a straightforward way to run exactly that pattern, launching a paced TV campaign from a disclosed budget and reading results against it, which is why it’s a good model to study while you build your own page.
I’d start with the cheapest fix first. Before any redesign, add the billing unit under every price, publish one worked spend example, and state your cap or cancellation rule next to the CTA. Those three edits cost an afternoon and remove the objections that quietly kill otherwise healthy pages.
Ready to see transparent pricing in action instead of just designing it? Adwave lets you start a TV campaign from $50, generates a broadcast-ready spot from your website URL, and paces spend so you never exceed your set budget across 100+ premium channels. Start your first test campaign today and read the results against a number you chose upfront.