Ready in minutes
AI builds your ad from a single prompt

April 23, 2026
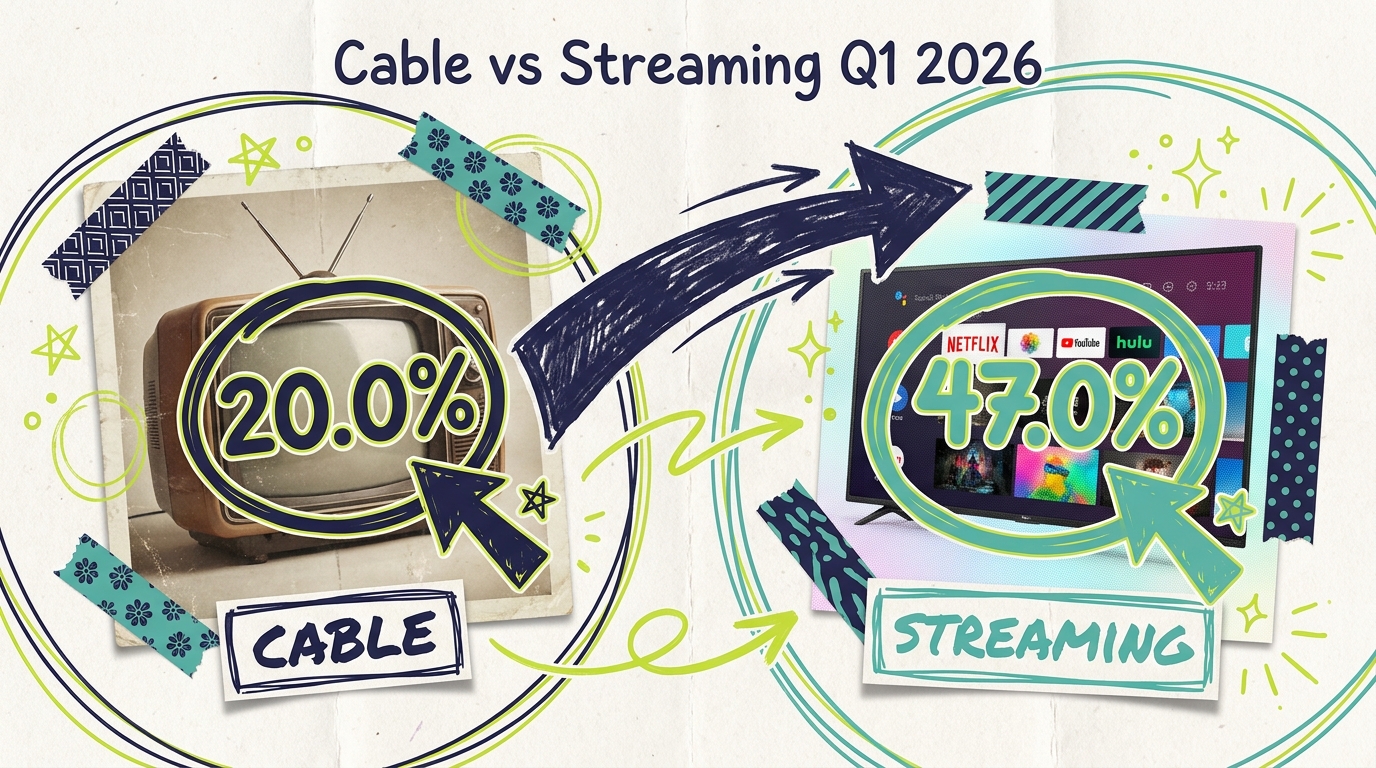
47.0%
Streaming share of U.S. TV viewing (Jan 2026 record)
20.0%
Cable share of U.S. TV viewing (Feb 2026 all-time low)
2.2x
Streaming's lead over cable in total viewing
The cable-versus-streaming story had another chapter in Q1 2026. Streaming hit 47.0% of U.S. TV viewing in January 2026, the highest share ever recorded in Nielsen's The Gauge. Cable fell to 20.0% in February 2026. Between the two numbers, the structural reshaping of American television continued. Streaming is larger than cable. It's also larger than broadcast. For advertisers and media planners, that shift reshapes nearly every TV buying decision.
But February 2026 also contained a reminder that linear TV is not dead. Super Bowl LX on NBC and the Milan-Cortina Winter Olympics drove broadcast to 21.7% in February, outperforming streaming's 41.9% decline for the month. For two weeks in February, linear TV (broadcast plus cable) briefly exceeded streaming again. Event-driven disruption hasn't gone away; structural majority streaming has.
This post breaks down what Nielsen reported for Q1 2026, explains the February event effect, and translates the data into practical implications for small business advertisers.
Based on Nielsen's The Gauge:

January 2026: Streaming 47.0% (record high), Broadcast 21.2%, Cable approximately 25-26% (Nielsen), Other the remainder
February 2026: Streaming 41.9%, Broadcast 21.7%, Cable 20.0%, Other the remainder
March 2026: Release delayed by Nielsen per MediaPost's March 20, 2026 report on methodology disputes
The February 2026 figures were released in mid-April 2026 after Nielsen delayed the report multiple times. MediaPost reported on April 14, 2026 that the February Gauge "shows little change" on overall viewing mix but revealed NBCUniversal-Versant dethroning YouTube for the top individual media entity (13.1% vs 12.7%) thanks to Super Bowl and Olympic coverage.
Cable's 20.0% February share is the lowest that category has held in Nielsen's published Gauge data. Nielsen reported the figure as "cable sank to 20.0% (from 23.2% in the previous year)," framing the drop as year-over-year rather than month-over-month, which reflects the continued structural decline of the cable category.
Nielsen has previously reported streaming surpassing combined broadcast and cable viewing for the first time in mid-2025, after which streaming has generally held the majority share. Nielsen's December 2025 Gauge also noted streaming reaching 47.5% that month, signaling that streaming's majority has become the baseline, not the exception.
Nielsen's The Gauge is a monthly report that splits total U.S. TV viewing time into the major content categories. The report launched in 2021 and has been Nielsen's primary public view of cross-platform viewing since. The Gauge combines Nielsen's panel-based measurement of linear TV with its streaming measurement to produce one consolidated picture.
A few methodology points matter when reading Gauge figures:
Viewing time, not household count: The Gauge reports total minutes viewed. Two services can have similar household penetration but very different Gauge shares if their audiences watch for different amounts of time.
TV screen only: The Gauge generally measures viewing on television screens, not laptops, phones, or tablets. Streaming platforms with heavy mobile audiences may have larger total reach than their Gauge share suggests.
Monthly data: Each Gauge is a single month. Quarterly or annual averages smooth seasonal patterns that single months don't.
Methodology updates: Nielsen is rolling out DASH, a new measurement approach that incorporates additional household data. Streaming platforms have raised concerns that DASH reduces their reported share. Nielsen has paused full DASH implementation pending industry review. January and February 2026 data use Nielsen's consistent pre-DASH approach.
For advertisers, The Gauge is the most widely referenced shared view of where U.S. TV time is spent. Media plans, buyer-seller negotiations, and forecasts all reference Gauge figures. Understanding what The Gauge measures (and what it doesn't) helps advertisers interpret the data accurately.
Streaming's 47% share versus cable's 20% share changes nearly every TV advertising decision for small businesses in 2026.

First, cable advertising reaches fewer viewers than it used to. A cable ad in 2026 reaches the 20% of TV time spent on cable, not the 40%+ it reached a decade ago. Cable still makes sense for specific audiences (sports networks, news networks, Spanish-language broadcast), but general-audience cable is no longer cost-competitive with streaming for broad reach.
Second, streaming is not one thing. The 47% streaming share is split across YouTube, Netflix, Hulu, Disney+, Prime Video, Peacock, Paramount+, Max, Tubi, Roku Channel, and dozens of smaller platforms. Each has different audience demographics and different CPM structures. Advertisers who want to "buy streaming" effectively need a multi-platform plan.
Third, live events still move the needle for linear TV. The February 2026 surge for broadcast was driven entirely by Super Bowl and Olympic programming on NBC. Outside of those specific events, broadcast and cable continue their structural decline. Live sports and news remain cable and broadcast's most defensible territory.
Fourth, structural restructuring is underway. Comcast spun off cable networks (MSNBC, CNBC, E!, Syfy, USA, Oxygen, Golf Channel) into Versant in late 2025. Warner Bros. Discovery is considering similar separation. These corporate moves reflect acknowledgment that cable is a declining business increasingly separate from streaming growth.
For small businesses shifting budget from cable-heavy to streaming-majority TV plans, a practical framework:
Step 1: Define your audience. Age, location, and interest tell you which platforms match. Younger audiences skew toward YouTube and FAST platforms. Affluent adult audiences skew toward Netflix and Hulu. Family audiences skew toward Disney streaming. Local audiences skew toward local broadcast news plus bundled CTV.
Step 2: Identify 4-6 core platforms. Most effective media plans concentrate budget on a handful of platforms rather than dilute across many. A reasonable starting mix for a general-audience local advertiser includes YouTube (scale and younger demographics), Netflix or Hulu (premium adult audiences), Disney+ (family reach), Prime Video (sports and adult audiences), plus at least one FAST platform (Tubi, Roku Channel, or Pluto TV for cost-efficient reach).
Step 3: Allocate budget by platform scale. A rough starting allocation might weight YouTube at 25-30%, premium SVOD (Netflix/Hulu/Disney+) at 40-50% combined, Prime Video at 10-15%, and FAST at 10-15%. Adjust based on audience match.
Step 4: Reserve cable budget for specific audiences. If your customer base includes sports fans, news consumers, or Spanish-language viewers, keep a targeted cable layer at 10-20% of TV budget. Skip cable for general-audience advertising.
Step 5: Budget for live-event surges. Super Bowl, Olympics, NFL playoffs, March Madness, election coverage, and major award shows concentrate linear TV audiences in ways streaming doesn't replicate. Plan targeted surge buys around these events if your business is seasonal or event-adjacent.
Bundled CTV platforms simplify much of this. Instead of managing individual relationships with YouTube, Netflix, Hulu, and a dozen other platforms, advertisers can use a single self-serve platform that aggregates access. Adwave is one such platform designed for local advertisers.
Knowing cable has dropped to 20% and streaming has crossed 47% is useful. Turning that into ad strategy decisions is where the real wins happen.
Shift TV ad budget majority to streaming. Most local advertisers in 2026 should have streaming as the larger share of their TV plan.
Keep cable budget for specific use cases. Sports-adjacent, news-adjacent, and Spanish-language advertising still work well on cable.
Budget for live event surges. Super Bowl, Olympics, NFL playoffs, March Madness, and election coverage concentrate audiences on linear TV. Plan targeted buys around these moments.
Use bundled CTV platforms for multi-streaming reach. Platforms like Adwave aggregate access across YouTube, Hulu, Peacock, Tubi, Roku Channel, Prime Video, and other streaming apps so small advertisers can build multi-platform plans with a single buy.
Monitor Nielsen methodology updates. Nielsen is rolling out new DASH measurement. Published figures may shift as the methodology stabilizes, though the underlying audience behavior won't change.
One of the practical reasons advertisers are shifting from cable to streaming is that streaming offers better measurement. A few differences worth understanding:
Cable measurement relies primarily on Nielsen panel data plus local market ratings. It's the industry standard that's been used for decades, but it reports audience estimates rather than precise impression counts, and attribution to business outcomes is limited.
Streaming measurement offers per-impression reporting, reach and frequency at the household level, and integration with attribution tools that can tie ad exposure to website visits, app installs, or sales. Most streaming platforms also support Brand Lift Studies that measure changes in awareness or consideration among audiences exposed to ads.
For small businesses, the measurement differences matter because better measurement means better optimization. If a campaign isn't working, streaming data lets you identify why and adjust. Cable campaigns are harder to diagnose because the data is less granular.
As you plan your 2026 TV mix, factor measurement capability into the decision alongside audience reach. Streaming's measurement advantages compound over time as you learn which creative, targeting, and platform combinations work for your business.
The long trajectory of American television has been clear for a decade: cable losing share, streaming gaining share, broadcast remaining stable. Nielsen's Q1 2026 data continues that pattern with cable reaching new lows and streaming reaching new highs.
Industry forecasters expect the trajectory to continue. eMarketer's December 2025 forecast projects U.S. CTV advertising spending to reach $37.95 billion in 2026 (+14.5% year-over-year) and to surpass linear TV ad spending by 2028. Those projections assume cable will continue losing share and streaming will continue gaining.
For small business advertisers, the practical implication is that TV advertising budget allocation should follow audience behavior. In 2026 that means streaming-majority plans with targeted cable layers for specific audiences.
Nielsen's Gauge figures are the industry's best public view of TV viewing, but they have limitations:
The Gauge measures aggregate time, not ad-reachable time. Some streaming viewing is ad-free (premium subscription tiers without ads). Advertisers can only reach the ad-supported subset, which is smaller than total streaming time.
Monthly figures can reflect seasonal events. February 2026's broadcast surge was driven by Super Bowl and Olympics. Without those events, February would look like January.
Cable's 20% share masks internal divergence. News networks, sports networks, and Spanish-language broadcast have held up better than general-entertainment cable. Aggregate cable share doesn't show this.
Streaming's 47% share masks platform differences. Each streaming platform has different audience composition, CPM structure, and ad accessibility. Aggregate streaming share is useful for trend but not for planning.
Advertisers should use Gauge figures as directional context and layer in more granular platform-level data when making specific campaign decisions.
When did streaming pass cable?
Nielsen's The Gauge first showed streaming overtaking cable in July 2022, when streaming reached 34.8% and cable dropped to 34.4%. Streaming has mostly held the lead since, with occasional reversals during sports-heavy weeks. By Q1 2026, streaming's lead over cable has widened substantially.
Why did streaming drop in February 2026?
Super Bowl LX (NBC, February 8) and the Milan-Cortina Winter Olympics (February 6-22, heavy on NBC and affiliated networks) pulled viewing toward broadcast. Streaming's share dropped from 47.0% to 41.9%. When those events ended, streaming resumed its higher baseline.
What's the trajectory for the rest of 2026?
Industry analysts generally expect streaming share to continue gaining, cable to continue declining, and broadcast to remain stable. March Madness in March-April creates another linear-TV bump similar to Super Bowl/Olympics. Absent further tentpole events, the baseline trend is streaming gaining ground.
How should small businesses split budget between cable and streaming?
There's no single right answer, but for most general-audience small business advertisers in 2026, a streaming-heavy split (roughly 70-80% streaming, 20-30% cable) reflects current viewing behavior. Businesses targeting older audiences, sports fans, or news consumers may weight cable higher. Businesses targeting younger audiences should weight streaming even higher.
Is broadcast TV still relevant?
Yes. Broadcast has held relatively stable at 21-22% of U.S. TV viewing through Q1 2026. Local broadcast news remains one of the highest-reach video products in any local market, and tentpole broadcast events (Super Bowl, Olympics) remain unique in their ability to concentrate national audiences.
How does the Nielsen DASH methodology issue affect these numbers?
Nielsen is working on a new methodology (DASH) that would adjust how household streaming is measured. Streaming platforms have objected that the new methodology shows smaller streaming share. As of April 2026, Nielsen has delayed full DASH implementation. The January and February 2026 figures use consistent pre-DASH methodology.
Can small businesses afford streaming advertising?
Yes. Self-serve CTV platforms have lowered streaming advertising entry points to $50-$500 per month. Small businesses can access premium streaming inventory (YouTube, Hulu, Peacock, etc.) alongside FAST platforms through a single self-serve campaign. Traditional cable advertising, by contrast, often requires $500-$2,000 minimums per station in most markets.
For small businesses planning TV advertising in 2026, the Nielsen Q1 2026 data is a clear signal: streaming deserves the majority of most TV media plans. Cable should be a targeted layer for specific audiences rather than the default buy.

Adwave lets local advertisers create 30-second TV ads from their website URL and run them across 100+ premium streaming channels, including YouTube, Hulu, Peacock, Tubi, and most major streaming apps, for as little as $50. See how it works.