Ready in minutes
AI builds your ad from a single prompt

April 29, 2026
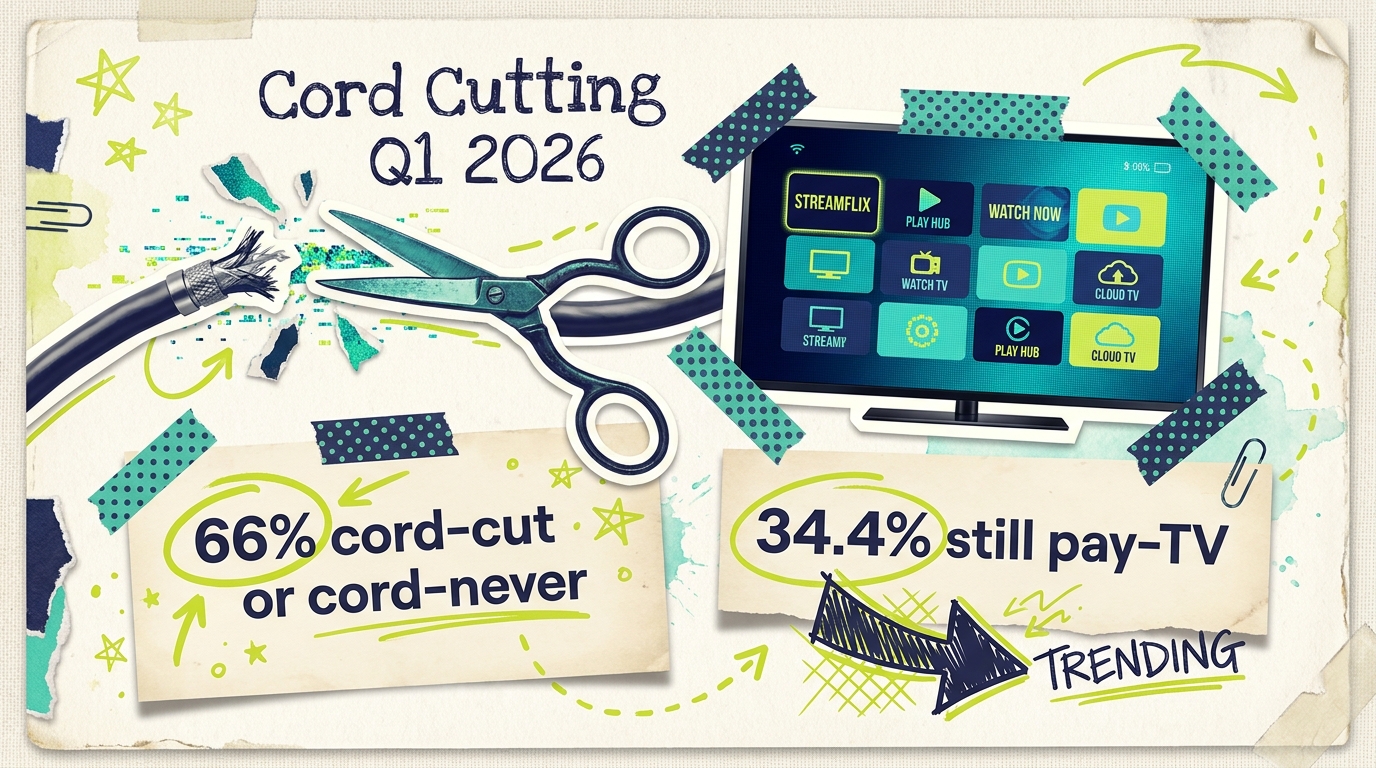
66%
U.S. households without traditional pay-TV
5M
Pay-TV subscribers lost in 2025 alone
34.4%
Households still subscribing to pay-TV (late 2025)
Cord cutting has entered a mature phase. The dramatic year-over-year subscriber losses that shook the pay-TV industry through the late 2010s and early 2020s have slowed, but pay-TV continues to decline. Per Leichtman Research Group data from late 2025, approximately 34.4% of U.S. households still subscribe to traditional pay-TV (cable, satellite, or telco TV).
For small business advertisers, cord cutting reshapes where TV audiences live. Most U.S. households no longer subscribe to pay-TV. Understanding who still subscribes, who's left, and where the audience consumes video now helps allocate advertising dollars correctly. This post summarizes publicly available cord-cutting data relevant to Q1 2026 and translates what the numbers mean for local advertisers.
Based on Leichtman Research Group data available through late 2025:

U.S. households with traditional pay-TV (late 2025): Approximately 34.4%
U.S. households without pay-TV: Approximately 66% (includes both "cord cutters" who previously subscribed and "cord nevers" who never did)
Comcast pay-TV subscriber loss, 2025: Approximately 1.15 million video subscribers (245,000 in Q4 2025 alone), per company reporting
YouTube TV: Added approximately 100,000 subscribers in Q1 2025, the only major pay-TV operator to grow during that period
Historical peak: U.S. pay-TV penetration peaked at roughly 82-83% in 2011
Leichtman Research Group publishes quarterly pay-TV subscriber reports covering major providers. Q1 2026 data for individual providers was not yet publicly available at the time of this writing; figures above reflect the most recent published data.
The rate of pay-TV decline has slowed compared to earlier years. Industry coverage in late 2025 indicated annual declines closer to 1-2 percentage points in household penetration rather than the steeper drops of 2020-2022.
Cord cutting statistics come from several sources, each with its own methodology:
Leichtman Research Group publishes quarterly reports tracking the largest U.S. pay-TV providers. Leichtman compiles subscriber counts directly from provider earnings reports and cross-references with industry data to produce household penetration estimates. Leichtman's reports are widely cited as the primary source for industry pay-TV trends.
S&P Global Market Intelligence (formerly Kagan) publishes independent pay-TV subscriber tracking with its own methodology. Their figures are generally similar to Leichtman's but can differ slightly due to measurement conventions.
Individual provider earnings reports are the ultimate source for any specific company's subscriber counts. Public companies (Comcast, Charter, Dish, DirecTV's parent, Altice) report subscriber totals and losses quarterly. Private companies may not report publicly.
Census Bureau and Federal Communications Commission data provide household context for interpreting subscriber percentages.
Industry research firms (Parks Associates, Forrester, Deloitte) publish various household behavior studies that complement the provider-tracking data. These often include qualitative findings about why households cut the cord and what they use instead.
For advertisers, the key point is that "34.4% of U.S. households have pay-TV" is a composite figure derived from multiple sources. Small variations between different research firms' reports are normal. The broad direction (continued decline, slowing pace) is consistent across all major sources.
Cord cutting reshapes TV advertising reach in ways that directly affect small business budgets.

First, cable advertising reaches fewer households than it used to. In 2011, a cable TV ad reached the majority of U.S. households. In 2026, a cable ad reaches approximately 34% of U.S. households at most. Cable still works for specific audiences (sports, news, Spanish-language programming), but broad-reach cable campaigns have lost scale.
Second, streaming advertising is where the audience went. The roughly two-thirds of U.S. households without pay-TV consume video primarily through streaming platforms: YouTube, Netflix, Hulu, Prime Video, Disney+, and free ad-supported services like Tubi and Roku Channel. Advertisers who skip streaming effectively miss most U.S. households.
Third, pay-TV's remaining audience skews older and higher-income. Industry analyses consistently show older demographics maintaining pay-TV at higher rates than younger demographics. If your customer base includes seniors, pay-TV still reaches them. If your customer skews younger, pay-TV misses them.
Fourth, virtual MVPDs are a hybrid category. Services like YouTube TV, Hulu + Live TV, Sling TV, and FuboTV deliver live-TV programming through streaming infrastructure. They carry similar content to cable but through streaming apps, often with better targeting and measurement capabilities.
When households cut the cord, they typically replace pay-TV with one or more of these alternatives:
Subscription streaming services (SVOD): Netflix, Prime Video, Disney+, Max, Paramount+, Peacock, Apple TV+, and various others. Many households subscribe to several services simultaneously. The combined cost of multiple SVOD subscriptions has in some cases approached or exceeded cable bundle pricing, a phenomenon sometimes called "streaming fatigue."
Free ad-supported streaming TV (FAST): Tubi, Roku Channel, Pluto TV, Freevee, and others. These services are free to viewers and entirely ad-supported, making them attractive for price-sensitive cord-cutters.
Virtual MVPD services: YouTube TV, Hulu + Live TV, Sling TV, FuboTV. These deliver live-TV channels through streaming apps, effectively replacing the live-TV portion of a cable bundle. vMVPD subscriptions are typically lower than comparable cable bundles but have risen over time.
Over-the-air antenna: Households can receive broadcast network signals (NBC, CBS, ABC, Fox, PBS, local channels) for free through an antenna. Antenna households often combine free broadcast with streaming services for a low-cost TV experience.
YouTube: As the largest individual streaming platform by viewing time, YouTube fills a significant share of former cable viewing for many cord-cutters, particularly younger ones.
For advertisers, the practical implication is that reaching cord-cutters requires a streaming-inclusive media plan. Each cord-cutter's specific mix varies (some heavy Netflix, others heavy FAST, others mostly YouTube), so bundled CTV platforms that cover multiple streaming services typically deliver broader cord-cutter reach than single-platform buys.
Match channel to customer age. If your customer skews 50+, pay-TV still reaches them. If your customer skews under 35, streaming is where they are.
Reduce cable allocation for broad-audience campaigns. Cable reaches 34% of households at most; streaming reaches a much larger share. Allocate based on audience behavior.
Keep cable for specific use cases. Sports-adjacent (ESPN, regional sports networks), news-adjacent (Fox News, CNN, MSNBC), and Spanish-language (Univision, Telemundo) remain strong cable categories.
Include virtual MVPDs in the mix. YouTube TV, Hulu + Live TV, and Sling reach live-TV viewers who have cord-cut from traditional pay-TV but still want live programming. Bundled CTV platforms typically include this inventory.
Don't ignore FAST. Free ad-supported streaming (Tubi, Roku Channel, Pluto TV) reaches price-sensitive audiences that are difficult to find elsewhere.
As pay-TV households decline, cable network economics shift in ways that affect advertising:
Cable network subscription fees decline. Cable networks make most of their money from per-subscriber fees paid by cable operators, not from advertising. As pay-TV household count drops, aggregate subscription revenue declines. Networks must compensate through other revenue sources, one of which is advertising. This can push cable CPMs up even as cable audience declines.
Cable programming budgets are under pressure. Declining subscription revenue affects what networks can spend on content. Some cable networks have reduced original content spending. This further weakens cable's audience competitiveness against streaming.
Streaming platforms are capturing reinvested content dollars. The major streaming platforms (Netflix, Prime Video, Disney+, Max, Paramount+, Peacock) continue to invest heavily in original programming. The content quality advantage that pay-TV bundles once held over streaming has largely disappeared.
Advertiser migration reinforces the cycle. As advertisers shift budget toward streaming, streaming platforms have more revenue to invest in content, which attracts more viewers, which attracts more ad spending. The flywheel favors streaming.
For small business advertisers, the practical implication is that streaming's advantages over cable are likely to widen, not narrow, over the next several years.
Cord cutting at Q1 2026 is a mature phenomenon. The dramatic years of rapid decline are largely behind us. What's happening now is stabilization at a smaller base with specific demographic and geographic characteristics.
Why pay-TV has stabilized: the remaining 34.4% of households who subscribe tend to have specific reasons streaming doesn't yet solve. Live local sports bundling, older demographics, certain geographic areas with limited broadband alternatives, and households that prefer single-bill simplicity.
The pay-TV operators themselves have also adapted. Many cable providers now bundle Netflix, Peacock, or other streaming services into their cable packages to retain subscribers. DirecTV and Dish have shifted toward streaming-delivery models. YouTube TV continues to grow while traditional MVPDs decline.
For small business advertisers, the practical implication is that TV advertising budget should continue shifting toward streaming year over year. Maintaining cable-heavy allocations based on 2015-era household behavior patterns is no longer cost-efficient for broad-audience campaigns.
Cord-cutting statistics are useful signals, but they have limitations:
Aggregate penetration masks demographic variation. The 34.4% figure is an average. Specific demographics (older adults, higher-income households, rural households in some markets) have much higher pay-TV penetration. Other demographics (younger adults, urban households) have much lower penetration.
Virtual MVPD subscribers are counted differently. YouTube TV, Hulu + Live TV, and similar services deliver live-TV programming but are typically not counted in "pay-TV" figures. Whether you consider these cord-cutters depends on definition.
The quarterly provider-loss figures don't fully represent household behavior. A household that switches from Comcast to YouTube TV shows up as a Comcast loss but not a cord-cutter in the true sense. Provider-level figures can understate or overstate the underlying household behavior depending on how subscriptions are categorized.
Cord-cutters still watch live-TV content, just through different delivery. The cord-cutting trend is about delivery method, not about viewing content categories. Sports, news, and entertainment are still consumed, just through streaming rather than cable.
Advertisers should treat aggregate cord-cutting figures as directional and layer in platform-specific and demographic data when making specific campaign decisions.
How many Americans have cut the cord?
Approximately 66% of U.S. households no longer subscribe to traditional pay-TV, based on Leichtman Research Group data from late 2025. That figure includes both cord cutters (formerly subscribed) and cord nevers (never subscribed). About 34.4% of households still subscribe to some form of traditional pay-TV.
Is cord cutting still accelerating?
The pace has slowed compared to earlier years. Industry coverage in late 2025 indicated annual declines of roughly 1-2 percentage points, down from steeper drops during 2020-2022.
What's the difference between cord cutters and cord nevers?
Cord cutters had pay-TV at some point and canceled. Cord nevers have never had pay-TV, typically younger adults who entered adulthood during the streaming era. Both categories are growing as a share of U.S. households.
Is YouTube TV considered pay-TV?
YouTube TV is a virtual MVPD (vMVPD), which delivers live TV through streaming rather than cable infrastructure. Research firms generally count virtual MVPDs separately from traditional pay-TV. YouTube TV added approximately 100,000 subscribers in Q1 2025 while traditional pay-TV operators lost subscribers.
What does cord cutting mean for TV advertising?
TV advertising has followed the audience to streaming. Advertisers who want to reach the two-thirds of households without pay-TV need streaming capabilities. Cable and broadcast remain valuable for specific audiences but no longer deliver the broad reach they once did.
Can small businesses advertise on virtual MVPDs?
Yes, through each platform's ad sales team or through bundled CTV platforms that aggregate vMVPD inventory alongside other streaming services.
Will pay-TV disappear entirely?
Industry analysts generally expect pay-TV to continue declining gradually but not to disappear in the foreseeable future. Some households have specific needs (live local sports, single-bill preference) that pay-TV serves better than streaming. Most forecasts project pay-TV penetration declining further but stabilizing at a meaningful minority share.
How should my business adapt to cord cutting?
The practical adaptation is to shift TV advertising budget toward streaming and CTV, match specific platforms to your customer demographic, and maintain targeted cable or broadcast layers for audiences that still prefer linear TV. Use bundled CTV platforms to simplify multi-platform streaming campaigns.
For small businesses planning TV advertising in 2026, cord cutting data is a clear signal: most U.S. households no longer have pay-TV, and TV advertising needs to reach them where they now consume video, which is primarily streaming.

Start by matching advertising channel to customer demographic. Older customers still reachable through cable and broadcast. Younger customers primarily reachable through streaming. Most small businesses benefit from a streaming-majority plan with targeted cable layers for specific audiences.
Adwave lets local advertisers reach the two-thirds of U.S. households without traditional pay-TV through 100+ streaming channels, including YouTube, Netflix, Hulu, Peacock, Tubi, and Roku Channel, with campaigns starting at $50. See how it works.