Ready in minutes
AI builds your ad from a single prompt

November 28, 2025
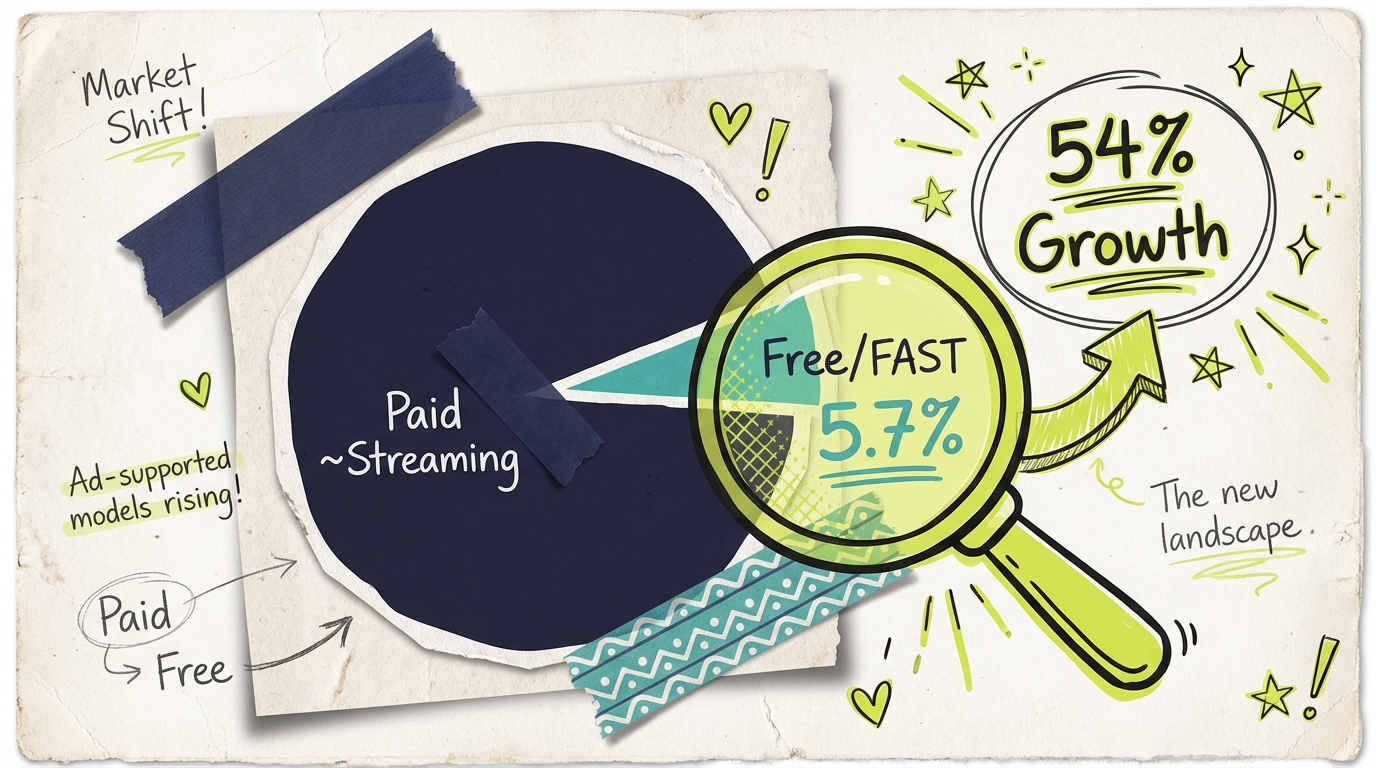
5.7%
FAST platforms share of TV viewing
19%
Paid SVOD share of TV viewing
3.3x
Paid streaming leads over free streaming
Free ad-supported streaming services (FAST) now capture 5.7% of total TV viewing in the United States, while paid subscription streaming (SVOD) commands approximately 19% of viewing share, according to Nielsen Gauge data. Together, these segments represent the majority of streaming's record 47.3% total TV share. However, the growth trajectories tell a more nuanced story: free streaming is growing faster than paid, with FAST services like Tubi, Pluto TV, and The Roku Channel gaining share while traditional SVOD growth plateaus. For advertisers, this shift represents an expanding opportunity to reach premium streaming audiences without premium price barriers.
The comparison between free and paid streaming reveals a market in transition, with advertising-supported models gaining momentum.
Nielsen's Gauge report tracks viewing across all streaming platforms:
Free streaming (FAST/AVOD):
Combined FAST share: 5.7% of total TV viewing (May 2025)
The Roku Channel: 2.8% share
Tubi: 2.2%+ share
Pluto TV: Approximately 1.0% share
Free tiers of paid services add additional share
Paid streaming (SVOD):
Netflix: 7.9% share (pure subscription, though now has ad tier)
Amazon Prime Video: 3.1% share
Disney+: 1.9% share
Hulu: 2.1% share (hybrid model)
Max, Peacock, Paramount+: Collectively approximately 4%
The total streaming market represents 47.3% of TV viewing, with free services capturing roughly 23% of streaming's overall share and growing.
The two segments show different growth patterns:
Free streaming growth:
FAST platforms grew from 3.7% of TV viewing (February 2024) to 5.7% (May 2025)
54% growth in just 15 months
Tubi viewing up significantly year-over-year
FAST-using monthly active households up 12% YoY, according to Wurl research
Nearly 50% of US households now watch FAST channels weekly
Paid streaming growth:
SVOD subscriber growth has plateaued in mature markets
Netflix added subscribers but growth rate slowing
Disney+ subscriber count stable
Average revenue per user flat: $65.21 (2023) to $67.66 projected (2028), according to PwC research
Revenue tells a different story than viewership:
Current revenue:
Global SVOD: Approximately $150 billion annually
Global premium AVOD: Approximately $50 billion annually
Projected 2029 revenue (Omdia):
SVOD: $185 billion
Premium AVOD: $141 billion
Online video advertising total: $362 billion
The revenue gap is narrowing as advertising models scale and subscription fatigue limits SVOD growth.
Examining individual platforms reveals the competitive dynamics within each segment:
Leading FAST platforms:
Tubi (Fox): The free streaming service has grown to 80+ million monthly active users globally, making it one of the largest FAST platforms. Tubi offers 50,000+ titles without requiring registration, reducing friction for viewers. Its acquisition by Fox in 2020 brought content advantages and integration with Fox's broader advertising sales operation.
Pluto TV (Paramount): With 200+ live channels and thousands of on-demand titles, Pluto TV pioneered the linear-style FAST experience. Paramount's ownership connects Pluto to deep content libraries including CBS, Comedy Central, and MTV programming. The platform reaches over 80 million monthly active users globally.
The Roku Channel: Operating on Roku's dominant connected TV platform gives The Roku Channel distribution advantages. It has grown to 2.8% of total TV viewing, benefiting from integration into the Roku home screen and remote buttons. Original content investments have increased viewer engagement.
Major SVOD platforms:
Netflix: Despite adding an ad tier, Netflix remains primarily subscription-driven. Its 282+ million global subscribers generate the majority of revenue through monthly fees. However, the ad tier's 70+ million monthly active users represent meaningful advertising inventory growth.
Amazon Prime Video: Amazon's 2024 decision to add advertising to all Prime Video viewers transformed the platform overnight into a massive ad-supported service. With 200+ million Prime members having video access, this represents the largest single ad inventory expansion in streaming history.
Disney+ and Hulu: Disney's streaming strategy spans both services, with Hulu offering hybrid ad/subscription models for years and Disney+ adding an ad tier in 2022. Combined, Disney's streaming properties reach over 170 million subscribers globally.
Understanding what drives each segment's performance helps advertisers make informed decisions.
Several factors drive FAST's rapid growth:
Subscription fatigue: The average US household subscribes to 3-4 streaming services. Deloitte research indicates "SVOD stacking has reached its limit and will start declining in 2025." Consumers are dropping services and turning to free alternatives for content variety.
Content quality improvement: FAST services have invested heavily in content. Tubi now offers 50,000+ titles. The Roku Channel has expanded original programming. Pluto TV carries live channels from major networks. The quality gap between free and paid has narrowed substantially.
Economic pressure: Inflation and economic uncertainty make free options more attractive. When budgets tighten, entertainment subscriptions often get cut. Free streaming provides similar entertainment value without monthly fees.
Discovery and convenience: Smart TV integration has made FAST discovery effortless. Many viewers find FAST channels while browsing, and the friction-free access (no account required for many services) drives adoption.
SVOD faces several headwinds:
Market saturation: In the US, streaming penetration has reached 96% of households, according to Kantar research. Growth must come from share shifts rather than new adopters.
Price increases: Every major SVOD has raised prices multiple times since 2022. Netflix's standard plan now exceeds $15/month. Disney+ increased prices 27% in 2023. These increases push price-sensitive consumers toward free alternatives or ad-supported tiers.
Content fragmentation: Consumers must subscribe to multiple services to access desired content. This fragmentation creates frustration and drives cord-cutting from streaming services themselves.
Ad tier cannibalization: The most successful SVOD growth is in ad-supported tiers, not premium subscriptions. Netflix reports 70+ million monthly active users on its ad tier. This growth dilutes pure subscription revenue.
Many services now straddle both categories:
Netflix: Subscription-first with growing ad tier
Hulu: Long-standing hybrid model
Peacock: Free tier available alongside premium
Amazon Prime Video: Added ads to all users in 2024
Disney+: Ad tier growing faster than ad-free
This hybridization blurs the line between free and paid, with advertising becoming central to nearly all streaming business models.
Content libraries differ significantly between free and paid:
Free streaming content:
Older catalog titles and library content
Some original programming (Tubi Originals, Roku Originals)
Licensed content from major studios
Live linear channels with curated programming
News and sports highlights (limited live sports)
Paid streaming content:
New release films and series
Exclusive original programming
Live sports (increasingly)
Day-after broadcast TV (Hulu)
Premium film releases
The content gap has narrowed as FAST services invest in originals and secure better licensing deals. However, first-run premium content remains primarily on paid services, creating differentiation that justifies subscription fees for engaged viewers.

For advertisers, the free vs. paid streaming dynamic creates distinct opportunities and considerations.
Free streaming growth expands total addressable advertising inventory:
FAST platform inventory:
100% ad-supported viewing
Lower CPMs than premium SVOD ($8-15 vs. $25-40)
Broad demographic reach
Less competitive ad environment in some cases
SVOD ad tier inventory:
Premium content adjacency
Higher-intent viewers (willing to pay for content)
More sophisticated targeting capabilities
Brand-safe environments
Together, these sources have increased available streaming ad inventory by over 50% in the past two years.
Free and paid streaming attract different but overlapping audiences:
Free streaming audience:
Broader demographic distribution
More price-sensitive consumers
Heavy viewers (high frequency, long sessions)
Discovery-oriented (browsing channels)
Higher concentration of cord-cutters and cord-nevers
Paid streaming audience:
Higher average household income
More intentional viewing (searching specific content)
Lower ad tolerance (chose cheaper tier for price, not preference)
Stronger brand affinity for specific services
For many advertisers, reaching both audiences provides comprehensive streaming coverage.
Different goals suggest different platform emphases:
For maximum reach: Prioritize FAST platforms through aggregated CTV buying. Services like Adwave include Tubi, Pluto TV, Roku Channel, and 100+ other channels in a single campaign. Low CPMs enable broader reach within budget.
For premium positioning: Focus on ad tiers of major SVOD services. Netflix, Hulu, and Disney+ ad tiers place your message adjacent to premium content. Higher CPMs but stronger brand association.
For local businesses: FAST services often excel at geographic targeting for local TV advertising. Combine with premium SVOD for comprehensive local market coverage.
For budget efficiency: FAST platforms deliver the most impressions per dollar. A $500 campaign on FAST services can deliver 20,000-50,000 impressions. The same budget on premium SVOD might deliver 10,000-15,000.
The free streaming surge creates actionable opportunities for advertisers.
Rather than negotiating with individual services, use aggregated CTV platforms:
Access FAST and SVOD inventory in one campaign
Single interface for targeting and measurement
Automated optimization across sources
Low minimums ($50 on Adwave)
This approach captures the full spectrum of streaming viewers without complexity.
Many advertisers underestimate FAST effectiveness:
Run a FAST-focused test campaign with $200-300 budget
Compare results to social/search campaigns on similar budget
Measure brand lift through search increases and website traffic
Evaluate efficiency in terms of cost per completed view
Often, advertisers discover FAST delivers comparable or better results at lower cost than assumed.
Consider a portfolio approach:
70% budget to FAST/aggregated CTV for reach and efficiency
30% budget to premium SVOD for brand positioning
This mix maximizes impressions while maintaining premium content association.
Free and paid streaming have different viewing patterns:
FAST viewing peaks:
Daytime hours (stay-at-home viewers)
Weekend afternoons
Evening "channel surfing" hours
SVOD viewing peaks:
Prime time evenings (intentional viewing)
Weekend binge sessions
New content release windows
Understanding these patterns helps optimize campaign timing for each segment.

The free vs. paid streaming comparison reflects broader industry transformation.
According to Streaming Media Global, "Advertising is now the biggest revenue earner in online video." By 2029, online video advertising ($362 billion) will far exceed subscription revenue ($185 billion). This represents a fundamental shift from the ad-free streaming premise that defined Netflix's early years.
Every major streaming service has embraced advertising:
Netflix launched ads in 2022
Disney+ added an ad tier in 2022
Amazon added ads to Prime Video in 2024
Max, Peacock, and Paramount+ all offer ad tiers
The question is no longer whether streaming will be ad-supported, but how advertising will evolve within streaming environments.
By 2026, more homes globally will watch free content online than via broadcast television, according to Omdia research. FAST channels continue proliferating, with platforms now offering hundreds of linear-style channels alongside on-demand libraries.
Major media companies are investing in FAST:
Paramount owns Pluto TV
Fox owns Tubi
NBCUniversal operates Peacock's free tier
Warner Bros. Discovery operates free content through Max
This investment signals long-term confidence in advertising-supported streaming models.
The combined rise of free and paid streaming accelerates traditional TV decline:
Cable's TV share has dropped below 27%
Broadcast maintains approximately 20% primarily through sports and news
Approximately 6 million US households cut the cord in 2024
For advertisers still buying traditional TV, the audience continues migrating to streaming. Following that migration, whether to free or paid services, becomes increasingly important.
Free vs. paid streaming adoption varies by demographics and geography:
Age demographics:
18-34: Higher adoption of both free and paid, with FAST growing fastest
35-54: Balanced use, increasingly adopting FAST as subscription fatigue sets in
55+: Traditional TV remains significant, but FAST adoption growing as smart TV penetration increases
Income demographics:
Higher-income households: More likely to stack multiple paid subscriptions
Middle-income households: Hybrid approach with 1-2 paid plus FAST
Lower-income households: Higher reliance on free streaming, less willing to pay for multiple services
Geographic patterns:
Urban areas: Higher streaming adoption overall, more FAST experimentation
Suburban areas: Balance of cable retention and streaming adoption
Rural areas: Streaming adoption limited by broadband availability, but growing
Understanding these patterns helps advertisers target appropriate platforms for their audience demographics.
While this analysis focuses on US data, global trends show similar patterns:
Latin America: Strong FAST adoption due to economic factors; free streaming dominates
Europe: Slower FAST growth but accelerating; SVOD remains stronger than US
Asia-Pacific: Varied by country; India and Southeast Asia favor ad-supported models
US trends typically lead international markets by 2-3 years, suggesting global FAST growth will continue accelerating.
The distinction between free and paid streaming is blurring:
"Free" services monetize through advertising and data
"Paid" services increasingly rely on ad revenue
Hybrid models dominate new launches
Bundling reshapes how consumers access content
For advertisers, this convergence simplifies the strategic question: streaming matters, and reaching streaming audiences requires presence across the ecosystem.
Yes, often more effective per dollar spent. FAST platforms deliver lower CPMs ($8-15) compared to premium SVOD ($25-40) while reaching engaged viewers. Studies show FAST viewers are often more receptive to advertising because they expect ads as part of the free value exchange. The key is matching your goals to the right platform mix.
Free streaming (FAST services like Tubi, Pluto TV, and Roku Channel) represents approximately 5.7% of total TV viewing, while paid streaming captures approximately 19%. However, the boundary is blurring as paid services add ad-supported tiers and free services expand content quality. Within streaming's 47.3% total TV share, about 12% is free and 35% is various forms of paid or hybrid.
Ad load varies significantly between platforms. FAST services typically run 8-12 minutes of ads per hour, similar to traditional cable television. SVOD ad tiers generally feature lighter ad loads, with Netflix running approximately 4-5 minutes per hour and Disney+ at similar levels. Hulu's ad-supported tier falls in between at 6-8 minutes. Lower ad loads on premium SVOD command higher CPMs but may improve ad effectiveness through reduced clutter.
Both, ideally through aggregated platforms. Small businesses benefit from FAST's lower CPMs and broad reach while gaining premium SVOD exposure for credibility. Platforms like Adwave include both in a single campaign, automatically optimizing across sources. A $500 monthly budget can effectively reach both free and paid streaming audiences.
No. While FAST viewers skew slightly more diverse in household income, they include valuable demographics across all categories. FAST viewers tend to watch more total hours, creating more ad exposure opportunities. The "quality" of an audience depends on your target customer, not the platform they use.
Free streaming (FAST) grew approximately 54% in TV viewing share over 15 months (3.7% to 5.7%), while paid streaming growth has plateaued. SVOD subscriber counts are essentially flat in mature markets like the US. The growth differential is significant and expected to continue as subscription fatigue spreads.
Key statistics comparing free and paid streaming market share:
Viewing share (Nielsen Gauge):
Total streaming: 47.3% of TV viewing
FAST combined: 5.7% of TV viewing
Netflix: 7.9% of TV viewing
Prime Video: 3.1% of TV viewing
Disney+: 1.9% of TV viewing
Hulu: 2.1% of TV viewing
Growth metrics:
FAST growth: 54% increase in 15 months
FAST household reach: 50% of US households weekly
SVOD stacking: Peaked at 4 services, declining
Cord-cutting: 6 million households in 2024
Revenue projections (2029, Omdia):
SVOD revenue: $185 billion
Premium AVOD: $141 billion
Total online video advertising: $362 billion
Advertising metrics:
FAST CPMs: $8-15 range
Premium SVOD CPMs: $25-40 range
Ad-supported TV viewing: 73.6% of total
Data sources:
Whether viewers choose free or paid streaming, they're increasingly watching on connected TVs. Reaching both audiences maximizes your streaming coverage and advertising efficiency.
Adwave provides access to FAST services (Tubi, Pluto TV, Roku Channel) and premium SVOD ad tiers across 100+ channels. Campaigns start at just $50, with AI-generated commercials and no minimum commitments.