Ready in minutes
AI builds your ad from a single prompt

May 12, 2026
The first time you log in to your Adwave dashboard after launching a campaign, the numbers can feel a little overwhelming. Impressions, reach, frequency, CPM, completion rates, geographic breakdowns. None of these are concepts most small business owners deal with on a normal Tuesday morning.
The good news is you don't need to understand every metric to make great decisions. You need to understand five or six core numbers, what they mean in plain English, and which ones to pay attention to in your first week, your first month, and your first quarter. This guide walks you through the dashboard the way a friend who runs ads would walk you through it: what to look at, what to ignore, and when to take action.
Your Adwave dashboard is the live record of every impression your TV ad delivered, where it ran, who saw it, and what it cost. The platform pulls that data in continuously, so the picture you see at 10 a.m. Wednesday is different from the picture you'll see at 6 p.m. Wednesday.
Two things to keep in mind before you start clicking around:
Data settles, it doesn't instantly appear. When your ad runs at 8:43 p.m. on a connected TV in Tampa, that impression shows up in the dashboard within a few hours. Daily totals stabilize overnight. Don't refresh your dashboard every 20 minutes expecting a different picture.
The dashboard tells you what happened on TV. It doesn't tell you what happened in your business. Bookings, calls, walk-ins, and form fills live in your own systems. Connecting those two stories is where attribution comes in (more on that below).
Now let's walk through what you'll actually see.
The first row of metrics on your dashboard is the snapshot. Most beginners can do 90% of their job by understanding these six numbers.
Impressions. The total number of times your ad played on a TV screen. One household watching your ad three times = three impressions. This is your "how much TV did I just buy" number.
Reach. The number of unique households exposed to your ad at least once. If 1,000 households saw your ad and three of them saw it twice, your reach is 1,000 and your impressions are 1,003. Reach answers "how many different families did I get in front of?"
Frequency. Impressions divided by reach. The average number of times each household saw your ad. For most local businesses, the sweet spot is between 3 and 5. Under 2 means you're getting in front of people too few times to drive action. Over 7 means you're hitting the same households so often you're wasting impressions on people who've already decided.
CPM (cost per thousand impressions). What you're paying to reach 1,000 households. Adwave's CPM typically runs $15-35, with an average around $25. If you see CPM rising over time, it usually means competition for your inventory has tightened, often during high-demand windows like Q4 holidays or election season.
Spend. The total dollars deployed to date. Compare this to your campaign budget and the days elapsed to see whether you're pacing on schedule.
Completion rate. The percentage of viewers who watched your 30-second ad all the way through. On CTV, completion rates of 90-98% are normal because the ads play full-screen and can't be skipped on most premium inventory. If your completion rate drops below 85%, talk to support, something unusual is happening.
Below the snapshot row, you'll see a graph showing impressions, spend, or conversions over time. This is where most beginners overreact and most experienced advertisers find gold.

The trend tells you three things:
Is your campaign pacing evenly, or is it front-loaded or back-loaded? A steady line means your daily cap is doing its job and your ad is finding consistent inventory. A spiky line means there's volatility in available impressions on certain days.
Are weekends different from weekdays? For most local businesses, they are. Streaming hours peak Friday-Sunday, especially in households with kids. If you're a Sunday brunch spot, you want your impressions concentrated Friday and Saturday morning.
Is there a day-over-day pattern matching your business? A wedding venue might see best frequency Tuesday-Thursday when planning happens. A gym sees peaks Sunday and Monday around the "I'll start tomorrow" cycle.
Beginner tip: don't make decisions off a single day of data. Look at 7-day and 14-day windows. One slow Tuesday means nothing. A pattern of slow Tuesdays means something.
The geographic section shows you the ZIPs, cities, or DMAs receiving your impressions. This is where small targeting tweaks produce real ROI improvements, and where most beginners spot their biggest leak.
Open the geographic view and ask:
Are my impressions concentrated where my customers actually live? If you serve a 10-mile radius around your restaurant but a third of your impressions are landing 25 miles away, you have a targeting leak. Adwave support can tighten that for you.
Which ZIPs are pulling weight? If you tag inquiries by ZIP through your booking form or POS, you can see which areas are converting. Reinforce those.
Am I missing premium pockets? If you're a luxury home services brand and your highest-revenue customers come from two upscale ZIPs, make sure your campaign is reaching those ZIPs at adequate frequency, not just the broad metro average.
A single hour spent matching your impressions map to your customer map often improves performance more than any other adjustment you can make.
If you're running two or three ad variations (and you should be), the creative section shows which one is producing the most conversions per impression delivered. Adwave automatically rotates creative, but you decide which variations stay live and which get paused.
What to look at:
Conversion rate by creative. If creative A is converting at 1.4% and creative B at 0.7%, pause B and shift its impressions to A.
Completion rate by creative. A creative with a 99% completion rate is holding attention. A creative with an 88% completion rate is losing viewers, usually in the first 5 seconds.
CPM by creative. Premium inventory rewards creative that performs. Higher-quality scripts often pull lower CPMs from the auction over time.
Most beginners launch with one creative because it feels simpler. The businesses that get the most out of their first 90 days run two from the start, learn fast which one resonates, and put their budget behind the winner.
TV ads aren't clickable. A viewer can't tap your ad and land on your website. So conversion tracking on TV looks different from Google Ads or Meta. Adwave gives you a few ways to connect the dots:

Branded search lift. If your campaign is working, searches for your business name should rise during the campaign weeks. Pair your Adwave dashboard with Google Search Console to see this directly.
Direct traffic lift. TV viewers often type your URL into a browser later instead of clicking a link. Watch your direct traffic week over week during the campaign.
QR code or vanity URL. If your spot includes a unique URL like yourshop.com/tv or a QR code, you can attribute traffic directly. Adwave's dashboard shows you impression counts; your analytics tool shows you the visits and conversions on the other end.
Pre/post comparison. Compare your bookings, calls, or sales during the campaign weeks against the same metric during a baseline non-campaign period. The lift is your campaign's contribution.
"How did you hear about us?" intake. Have your front desk or booking form ask new customers, with TV as one of the explicit answers. It's not perfect, but combined with the other signals it gives you a real picture.
The biggest beginner mistake is expecting Adwave's dashboard to show you bookings or revenue directly. It can't. What it can do is show you impressions, reach, and creative performance, and you connect those to your own business data.
Trap 1: Reading too much into day-one data. Your first 24 hours of impressions can look uneven as the platform settles into your area and inventory. Don't make targeting changes in your first week. Let the data stabilize.
Trap 2: Comparing CPM to Meta or Google. CPMs across platforms aren't apples-to-apples. A $25 CPM on premium streaming reaches the same engaged household for 30 seconds of full-screen attention. A $5 CPM on Meta reaches the same person scrolling past in a half-second on their phone. The right comparison isn't the CPM, it's the cost per conversion in your own books.
Trap 3: Confusing reach with impressions. A campaign with 50,000 impressions and 10,000 reach is hitting the same 10,000 families 5 times each. A campaign with 50,000 impressions and 50,000 reach is hitting 50,000 families once each. The first one is built for action; the second one is built for awareness. Know which one you're running.
Your dashboard rewards a different focus depending on where you are in your campaign.
Week 1: don't optimize, observe. Log your baseline impressions, spend, frequency, reach, CPM, and completion rate. Don't touch the campaign. The platform needs the first week to find your inventory.
Week 2: check pacing and geography. Is spend on schedule? Are impressions landing in your service area? Are there obvious leaks? If yes, tighten targeting now.
Week 3-4: look at frequency. If you're under 2, your targeting is too broad and your audience isn't seeing the ad enough. If you're over 7, your targeting is too narrow and you're hitting the same households too many times. Adjust.

Month 2: test creative. If you launched with one creative, generate a second variation through Adwave's AI tools (it takes about 2 minutes) and run them side-by-side for two weeks. Pause the weaker performer.
Month 3 and beyond: refresh and scale. Creative loses effectiveness around the 60-90 day mark. Refresh. If your campaign is producing strong conversions and your frequency is in the 3-5 range, scaling budget 25-50% is a safe move. Avoid doubling overnight, which often raises CPM and dampens efficiency.
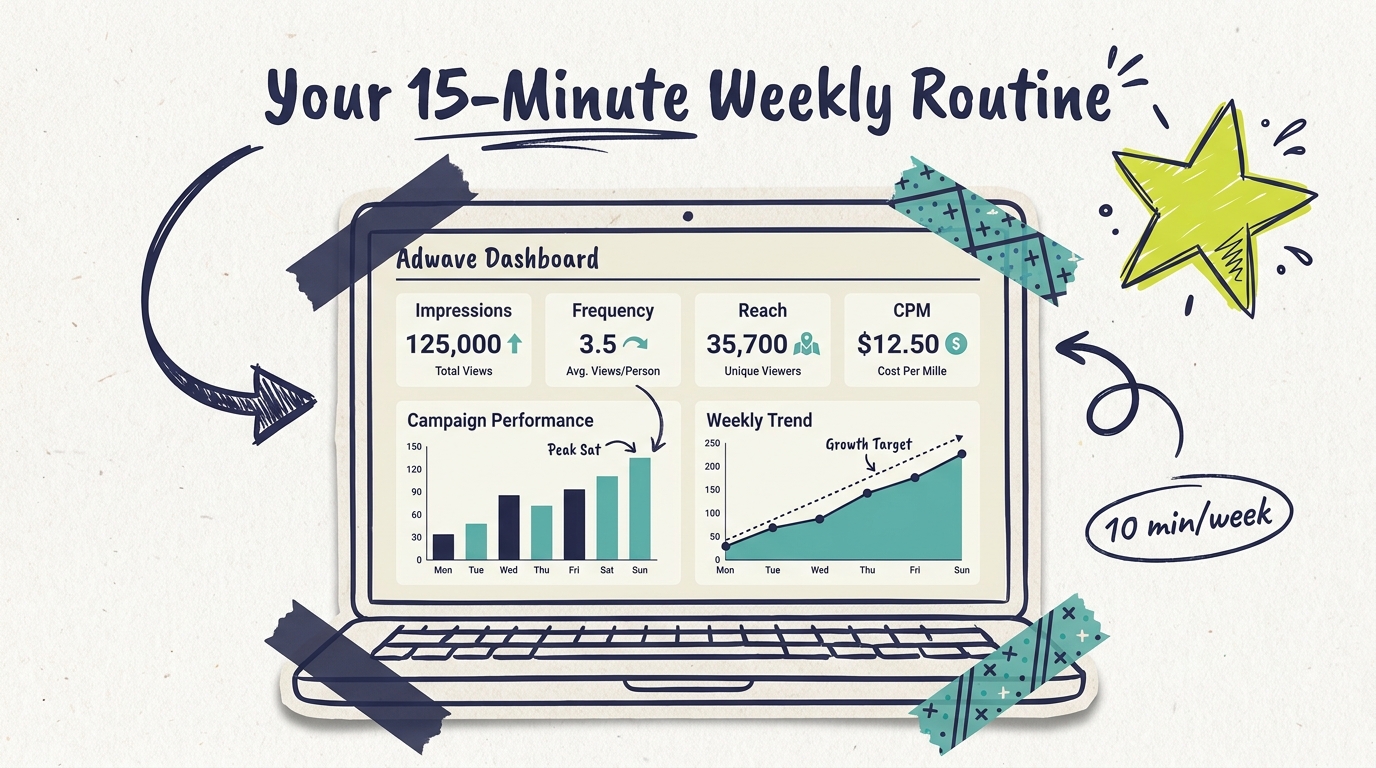
The small business owners who get the most out of TV advertising aren't the ones who refresh their dashboard six times a day. They're the ones who set a 10-minute weekly check and stick to it.
Step 1 (3 minutes). Glance at the snapshot row. Note any number that's dramatically different from last week. Big changes deserve a closer look.
Step 2 (3 minutes). Check spend pacing. If you're more than 15% off schedule (way ahead or way behind), plan a budget adjustment.
Step 3 (2 minutes). Check frequency. Trend it against your conversion data if you have it. Make one targeting decision: wider, narrower, or hold.
Step 4 (2 minutes). Note any creative or geographic finding worth a follow-up. Schedule the change for tomorrow, not right now.
Ten minutes a week, one decision at most. That cadence beats daily over-correction every time.
How often is the Adwave dashboard updated?
Data flows in continuously, but daily totals stabilize overnight. For decision-making, look at completed full days, not the partial current day. Weekly reviews on the same day each week give you the cleanest read on trends.
What's a "good" frequency number?
For most local small businesses, 3-5 is the sweet spot. Under 2 means you're not getting in front of the same households enough to drive behavior change. Over 7 means you're saturating the same households without producing more conversions. The right number for your business depends on category and sales cycle.
Why is my CPM higher than I expected?
CPM rises with demand. Q4 holidays, election windows, major sports events, and high-rated programming all push CPMs up. Your CPM also reflects the premium of the inventory you're running on. Adwave runs on 100+ premium networks, which is why CPM ranges $15-35 rather than the lower bargain-inventory rates you might see elsewhere.
The dashboard says I'm reaching 8,000 households, but my booking number didn't move. Why?
Reach is only part of the equation. Conversions depend on frequency (how many times each household saw the ad), creative (whether the message was compelling), and offer (whether the call to action was strong). If reach is healthy but conversions aren't moving, the next places to look are frequency and creative.
Can I see exactly which TV networks my ads ran on?
Adwave campaigns run across 100+ premium networks (NBC, Hulu, ESPN, and others) without individual network selection. The dashboard shows you aggregate performance rather than network-by-network breakdowns. The trade-off is that you reach a much broader, higher-quality audience than you would by buying any single network.
When should I contact Adwave support vs. making changes myself?
Make changes yourself for budget pacing, creative swaps, and pausing/resuming campaigns. Contact support for geographic targeting tweaks (especially tightening to specific ZIPs), unusual data patterns you can't explain, or anything that looks like a delivery issue.
Your Adwave dashboard isn't a scoreboard you check to feel good. It's a decision tool. Each number on the screen exists to tell you whether to widen, tighten, refresh, or hold. The owners who get the most out of TV advertising are the ones who treat their weekly dashboard review like a coffee-and-data session: 10 minutes, one decision, repeat.
Ready to launch your first campaign and start reading your own dashboard? Create your first ad with Adwave in about two minutes, set your service area and budget, and let your week-1 baseline begin.