Ready in minutes
AI builds your ad from a single prompt

April 25, 2026
YouTube
#1 most-watched streaming service in U.S. (Q1 2026)
12.7%
YouTube's share of total U.S. TV viewing
3.7pts
YouTube's lead over #2 Netflix
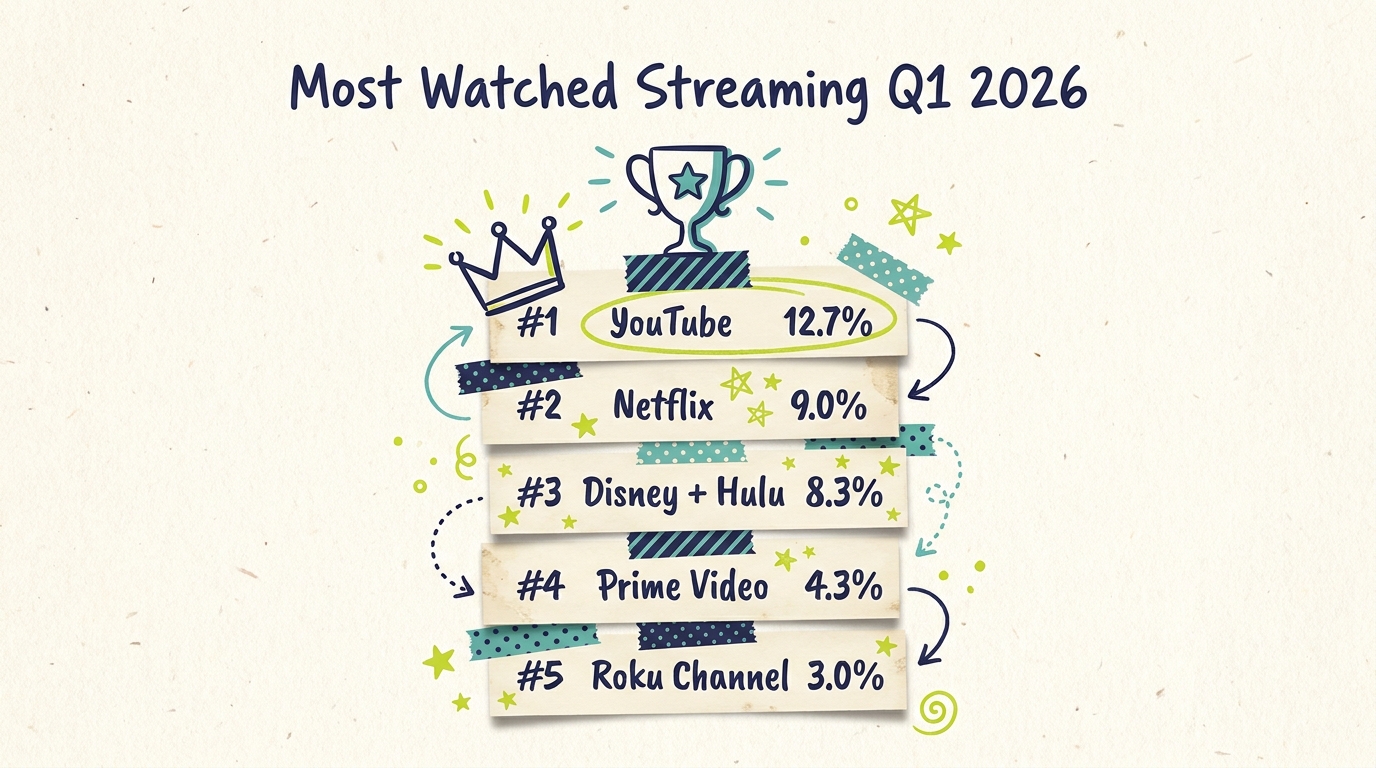
Different metrics produce different answers to "which streaming service is biggest?" When the metric is actual time spent watching on American TV screens, Nielsen's The Gauge makes the answer clear: YouTube leads. In January 2026, YouTube captured 12.7% of all U.S. TV viewing per Nielsen. Netflix came in second at 9.0%. No other platform individually crossed 5% in Nielsen's individual-platform reporting for Q1 2026.
For small business advertisers planning TV budgets in 2026, this ranking shapes where audience reach exists and how budget should be allocated across streaming platforms.
Here is the Q1 2026 ranking of streaming services by share of total U.S. TV viewing time, based on Nielsen's publicly released Gauge data:

January 2026 (Nielsen's The Gauge):
YouTube: 12.7% of total U.S. TV viewing
Netflix: 9.0%
Prime Video: 4.3%
Roku Channel (FAST): 3.0%
Tubi (FAST): 2.1%
Total streaming share: 47.0% (record high)
February 2026 (Nielsen, released April 2026):
YouTube: 12.7% (second in Media Distributor Gauge behind NBCU-Versant at 13.1%)
Disney (individual platform share): 5.0%
Peacock: 3.0% (record, event-driven)
Tubi: 2.2%
Total streaming share: 41.9% (event-driven pullback)
Nielsen has delayed the March 2026 Gauge report per MediaPost's March 20, 2026 coverage, so the full Q1 2026 picture relies on January and February data.
The gap between #1 YouTube at 12.7% and #2 Netflix at 9.0% is 3.7 percentage points, the largest gap between consecutive ranks on Nielsen's individual-platform chart. YouTube's position as the largest individual media entity on American TV has held across multiple months, though February 2026 temporarily placed NBCU-Versant at the top of the Media Distributor Gauge due to Super Bowl LX and Winter Olympics coverage.
"Which streaming service is biggest" sounds like a simple question but has multiple legitimate answers depending on how you measure:
Most time spent watching (Nielsen's The Gauge): YouTube leads among individual platforms at 12.7% of total U.S. TV viewing time. This is the most relevant metric for advertisers because it maps directly to where ad impressions can be delivered.
Most paying subscribers (global): Reported by each platform in its own earnings. Rankings vary by time period, and platform reporting conventions differ. Netflix is generally at or near the top of paid-subscriber rankings globally.
Most U.S. household reach (any viewing in a given month): Reported by research firms like Kantar, Parks Associates, and others. A household that watches five minutes of a service counts the same as one that watches five hours, so this metric favors platforms with broad but casual audiences.
Most advertising inventory available: Reflects both platform audience size and ad load. YouTube has large scale with relatively high ad load. Netflix has significant scale but low ad load by design.
For small business advertisers planning TV campaigns, Nielsen's viewing-time share is typically the most relevant ranking because it maps to where ads can actually reach audiences. Subscribers and reach are useful secondary data points but shouldn't drive media plans on their own.
Nielsen's The Gauge reports time spent viewing across major TV content distributors. The report launched in 2021 and has been published monthly since. A few methodology points matter for interpreting the rankings:
Total minutes, not unique viewers. A service with 10 million viewers who each watch 10 hours ranks higher than a service with 50 million viewers who each watch 1 hour.
TV screens only. The Gauge generally excludes mobile and desktop viewing. Platforms with heavy mobile audiences (YouTube notably) have larger total reach than their TV-only Gauge share suggests.
Monthly cadence. Each report covers one calendar month. Seasonal programming affects specific months.
Individual vs. distributor view. The Gauge reports individual platforms (Disney+, Hulu, YouTube) separately. The Media Distributor Gauge rolls up platforms by company (Disney, NBCUniversal, YouTube/Google).
Pre-DASH methodology for 2026 data. Nielsen is rolling out a new DASH measurement approach. Platforms have objected. Nielsen paused full implementation, and January/February 2026 figures use consistent pre-DASH methodology.
For advertisers, the rankings are most useful as directional signals about audience concentration. Monthly shifts happen, but the broad ordering (YouTube leads, Netflix second, Disney streaming third, Prime fourth, FAST services following) has been relatively stable.
The top-line share ranking tells you who gets watched the most. Other metrics tell different stories worth noting for advertisers:
By paid subscribers (global): Netflix leads; specific subscriber counts vary across reporting periods and are published quarterly by each company
By U.S. household reach: Netflix, Prime Video, and Disney+ each reach a majority of U.S. households at some point in a given month
By ad inventory available: YouTube offers the largest single pool of CTV ad inventory given its scale and free-to-user model
By price of access for advertisers: FAST platforms (Tubi, Roku Channel, Pluto TV) tend to carry lower CPMs than premium SVOD services
For small business advertisers planning TV campaigns, Nielsen's viewing-time share is usually the most relevant number because it maps directly to where ad impressions can be delivered.
The "most watched" ranking shapes where small business advertising dollars can deliver reach most efficiently.

First, YouTube's 12.7% share means any comprehensive streaming TV plan should include YouTube. Skipping YouTube inventory effectively ignores a large share of U.S. streaming TV attention.
Second, the combined top 4-5 platforms (YouTube, Netflix, Disney streaming, Prime Video, Roku Channel) cover a significant share of all U.S. TV viewing. A media plan that reaches these platforms captures most of the addressable streaming audience.
Third, FAST platforms (Tubi, Roku Channel, Pluto TV) are meaningful reach sources at lower CPMs. Their combined share plus the lower entry costs make them efficient additions to local campaigns.
Different streaming platforms reach different audiences. A framework for thinking about platform selection:
Scale and broad reach: YouTube. Covers the widest range of audiences, strong with younger demographics, lower average CPMs, massive inventory supply. Should be in most media plans.
Premium adult content: Netflix, Hulu, Max. Affluent and older demographics, brand-safe environments, premium CPMs, limited ad loads. Good for premium brands and advertisers who value content quality.
Family and kids: Disney+. Family-concentrated audience, brand-safe environment, premium CPMs. Essential for advertisers targeting parents or families.
Live sports and events: Prime Video (NFL, NBA rights), Peacock (Olympics, NFL), Paramount+ (NFL, UEFA). Sports-fan demographics, event-driven viewership spikes, higher CPMs during live events. Good for advertisers seasonally aligned with sports.
Price-sensitive/broad FAST audiences: Tubi, Roku Channel, Pluto TV, Freevee. Broad demographics, often lower-income skew, lower CPMs, high supply. Good for efficient reach and cost-conscious campaigns.
Spanish-language streaming: Limited individual streaming services at significant scale, but some platforms (Peacock, Paramount+) have Spanish content. For dedicated Spanish-language reach, broadcast (Univision, Telemundo) often still outperforms streaming.
Small business advertisers in 2026 generally benefit from a 4-6 platform plan that combines scale (YouTube), premium (Netflix or Hulu or Disney+), and efficient reach (at least one FAST service). Bundled CTV platforms simplify this by providing access across all major streaming services through a single campaign.
Knowing YouTube leads at 12.7% and Netflix follows at 9.0% is useful. Acting on it is where the wins happen.
Don't skip any platform above 3% share. That includes YouTube, Netflix, Disney/Hulu, Prime Video, Peacock, and Roku Channel. Each delivers meaningful reach.
Match platform to audience. Affluent adults 35-54 skew Netflix and Max. Younger viewers skew YouTube. Families skew Disney. Price-sensitive skews FAST.
Budget concentration, not dilution. Running $100 on each of ten platforms produces less impact than $500 on three platforms. Concentrate spend.
Include FAST in the mix. Tubi, Roku Channel, and Pluto TV together deliver substantial reach at 30-50% lower CPMs than premium streamers.
Measure reach and frequency, not just impressions. Different platforms deliver different audiences. Track unique-reach across your media plan.
Refresh creative quarterly. Streaming viewers hit ad frequency caps fast. Plan creative rotation to prevent fatigue.
Running campaigns across multiple streaming services creates measurement challenges. Each platform has its own reporting, and aggregating data across platforms requires either a bundled platform's built-in reporting or a third-party measurement service.
Key metrics to track when running multi-platform campaigns:
Unique household reach across platforms. A viewer who sees your ad on both YouTube and Hulu should count once in reach, not twice. De-duplication matters.
Frequency by platform. Different platforms have different ad loads, which affects per-platform frequency. Track per-platform frequency to avoid burning one audience while under-reaching another.
Impression share by platform. What percentage of your total impressions came from each platform. Helps diagnose whether you're actually reaching the intended platform mix.
Completion rate (VTR) by platform. Most CTV inventory is non-skippable, so VTR tends to be 90%+ across platforms. Significant VTR variations usually indicate an inventory quality issue.
Attribution to downstream outcomes. Website visits, branded searches, store visits, or sales attributable to your campaign. Platform-level attribution is ideal but not always available.
Bundled CTV platforms typically provide consolidated reporting across all included streaming services, which simplifies measurement for small business campaigns.
Nielsen's Q1 2026 rankings show streaming services at the top of U.S. TV viewing for another consecutive quarter. Total streaming reached 47.0% of U.S. TV viewing in January 2026 (Nielsen's record). Cable and broadcast together held 41.7% of viewing in February when Super Bowl/Olympics programming pushed linear TV temporarily higher.
The underlying trajectory is consistent: streaming is growing, cable is declining, and broadcast is stable. eMarketer's December 2025 forecast projects U.S. CTV advertising spending to reach $37.95 billion in 2026 (up 14.5% year-over-year) and to surpass linear TV ad spending by 2028. The streaming services at the top of Nielsen's rankings are positioned to capture most of that CTV ad revenue growth.
For small business advertisers, the practical implication is that the top streaming services are now the default starting point for any serious TV media plan. Cable and broadcast become targeted supplements for specific audiences rather than the base buy.
The Nielsen rankings are useful, but they have limits as a planning tool:
Individual platform shares don't capture ad supply. YouTube's large viewing share includes a lot of creator-driven content with many ad breaks. Netflix's smaller share includes fewer, less frequent ads. Advertisers comparing platforms should think about inventory supply alongside viewing share.
Demographic composition varies by platform. The same 1% of share on YouTube reaches different viewers than 1% of share on Hulu. Platform-level audience profiles matter for targeting decisions.
Monthly figures can misrepresent typical performance. Stranger Things Season 5 boosted Netflix in January 2026. Peacock's Super Bowl/Olympics February share won't recur. Quarterly or annual averages smooth these effects.
FAST and SVOD have different measurement baselines. Free ad-supported platforms may report viewing time differently than subscription platforms. Direct comparisons should account for measurement conventions.
Advertisers using Nielsen rankings should treat them as a starting framework, not the final answer. Specific platform choices should factor in audience match, inventory access, creative fit, and measurement capabilities beyond share of viewing.
Is YouTube really a streaming service?
Nielsen classifies YouTube under streaming in The Gauge. YouTube offers on-demand video delivered over the internet, usually to TV screens in 2026. By that definition, it qualifies. The main distinction is that YouTube's primary service is ad-supported and free, while most other streaming services are subscription-based.
How does Netflix compare to YouTube for advertisers?
They reach different audiences with different content environments and different CPM structures. Netflix delivers premium-content adjacency at premium CPMs. YouTube delivers massive scale and broader demographics at lower CPMs on average. Most thorough CTV plans include both.
Can small businesses advertise on all these platforms?
Yes, through bundled CTV platforms that aggregate access across streaming services. Direct platform-by-platform buying typically requires larger budgets and separate relationships with each platform's ad sales team.
What's the difference between subscriber counts and viewing share?
Subscriber counts measure how many households pay for a service. Viewing share measures how much time viewers actually spend watching. Platforms can have high subscriber counts but lower viewing share if subscribers are inactive, and vice versa. For advertisers, viewing share is typically the more relevant metric because it tracks where ad impressions can be delivered.
Will the rankings change over the rest of 2026?
Industry analysts generally expect the top of the ranking (YouTube, Netflix, Disney streaming) to remain relatively stable with most movement in the middle tier. The ongoing restructuring of Paramount Global, Warner Bros. Discovery, and other media companies may reshape the landscape, but major platform-level changes tend to happen slowly.
What's the best platform for local advertising?
No single platform is right for every local advertiser. Most small businesses see best results from a multi-platform plan that includes YouTube for scale, one or two premium services (Netflix, Hulu, Disney+) for audience quality, and at least one FAST platform (Tubi, Roku Channel) for cost-efficient reach.
How do I know if my campaign is working across multiple platforms?
Track consolidated metrics through a bundled CTV platform that reports across all your included services. Key metrics: unique household reach, per-platform frequency, video completion rate, and downstream brand metrics (branded search volume, website traffic). Allow 30-60 days before drawing conclusions.
The Nielsen Q1 2026 rankings point to a clear starting framework for local CTV campaigns: YouTube, Netflix, Disney streaming, Prime Video, plus one or two FAST platforms. That five-to-six platform stack covers most U.S. streaming TV viewing time and gives local advertisers meaningful reach across multiple audience segments.

Adwave lets local advertisers run TV campaigns across 100+ premium streaming channels, including YouTube, Netflix, Hulu, Peacock, Prime Video, Tubi, and Roku Channel, with a single buy starting at $50. See how it works.