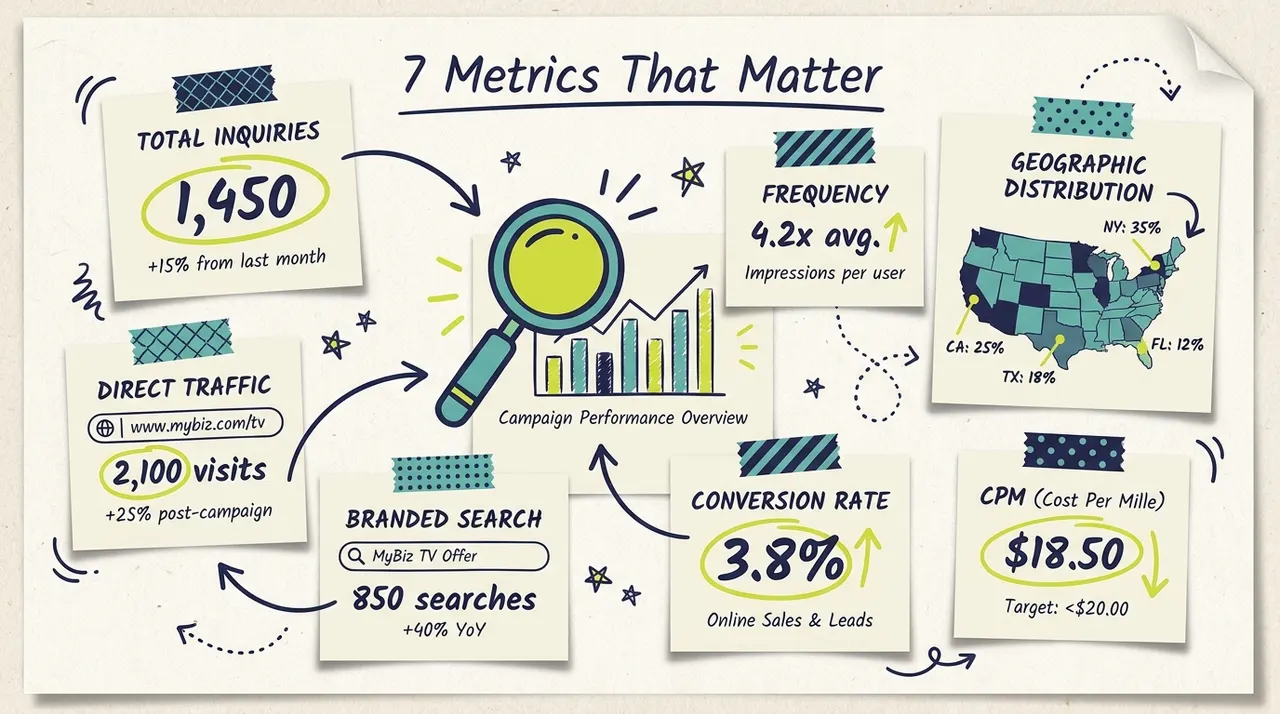
A small business owner staring at their first TV campaign dashboard sees a wall of numbers: impressions, reach, frequency, CPM, completion rate, spend pacing, daypart distribution, geographic delivery. Most of those numbers don't matter for decision-making. A handful do, and the difference between a campaign you understand and a campaign you guess at comes down to knowing which metrics are signal and which are noise.
This guide walks through the small-business TV campaign metrics that matter, what each one is telling you, when to act on it, and which metrics to ignore until you're scaling beyond local-business budgets. Whether you're running CTV at $1,000/month or $5,000/month, the framework here applies.
The seven core metrics worth tracking
Every effective small business TV campaign tracks roughly the same seven numbers. They're not equally important; we'll go in priority order from most decision-relevant to most informational.
1. Total inquiries (or sales, or conversions) over baseline
The most important number. The single question your campaign needs to answer: did total inquiries, calls, sales, or foot traffic rise during the campaign vs the pre-campaign baseline?
How to track:
Capture 4-6 weeks of pre-launch data on whatever your primary conversion metric is
Compare campaign weeks against that baseline
Report the delta as a percentage lift
Why it matters: this is the metric that justifies the spend. Direct attribution (TV-specific QR scans, vanity URL traffic, survey responses) will undercount TV's real impact by 30-70%. Total lift over baseline captures the full picture, including cross-channel lift to your Meta, Google, and organic channels.
What "good" looks like: 10-25% lift in the first 90 days of a well-targeted CTV campaign is typical. Higher than that signals strong campaign-to-business fit; lower than 5% signals either weak creative, broad targeting, or category mismatch.
2. Frequency
The average number of times each household saw your ad. Calculated as impressions divided by reach.
How to track: every CTV dashboard shows it. Watch the running 7-day or 14-day average rather than point-in-time numbers.
Why it matters: frequency is the most actionable lever you have. Most advertising research shows viewers need 3-5 impressions to drive behavior change. Frequency below 2 means your audience isn't seeing the ad enough; frequency above 7 means you're saturating the same households without producing more conversions.
What "good" looks like: 3-5 per household over your campaign window is the sweet spot for most small business categories. Lower than 2 calls for tighter targeting; higher than 7 calls for wider targeting.
3. Geographic distribution
Where your impressions are landing. The dashboard shows you by ZIP, city, or DMA depending on platform.
How to track: weekly review of geographic distribution against your real customer/service area.
Why it matters: the single most common reason small business CTV campaigns underperform is geographic leakage. If 25-40% of your impressions are landing outside your real service area, you're funding non-conversions. Tightening targeting is the highest-ROI optimization most small business owners can make.
What "good" looks like: 80-90% of impressions in your real customer geography. If less, contact platform support for targeting tightening.

4. CPM (cost per thousand impressions)
What you're paying to reach 1,000 households.
How to track: dashboard shows running average. Watch 14-day rolling CPM rather than daily numbers, which are noisy.
Why it matters: CPM helps you understand whether you're getting good value per impression. Adwave's typical CPM range is $15-$35 with an average around $25. CPM rising over time usually signals demand pressure (Q4 holidays, election windows, big sports events) or inventory tightness in your targeting.
What "good" looks like: $18-$28 for most small business CTV campaigns running on premium streaming inventory. Higher CPMs in highly competitive markets or during demand surges are normal; meaningfully lower CPMs usually indicate the ads are running on lower-quality inventory.
5. Creative-level conversion rate
If you're running multiple creatives in rotation, the conversion rate per creative tells you which one is doing the work.
How to track: most dashboards show conversion or click-through rate by creative when you have tracking pixels or UTM-tagged URLs in your spots.
Why it matters: with multiple creatives in rotation, the dashboard tells you which framing your audience responds to. The winning creative often differs from what the owner expected. Doubling down on the winner (pausing the loser) usually improves campaign-level conversion by 15-40%.
What "good" looks like: identify the strongest performer within 30-45 days, then concentrate impressions on it. If two creatives are similar, hold both in rotation for diversity. If one is clearly stronger, pause the weaker one.
6. Branded search lift
Searches for your business name during the campaign window vs the pre-campaign baseline. Tracked through Google Search Console.
How to track: pull weekly branded query reports from Search Console. Compare campaign weeks against pre-launch baseline.
Why it matters: branded search is one of the cleanest cross-channel lift signals you can capture. If your TV campaign is working, branded search will rise. A 20-40% lift in branded search during a CTV campaign window is typical for well-targeted campaigns. The branded search lift then converts on Google ads or organic Google results, attributing the conversion to Google rather than to TV.
What "good" looks like: 15-40% branded search lift over baseline during active CTV flights. Higher lift suggests strong campaign-to-audience fit; lower lift suggests creative or geographic targeting issues.
7. Direct website traffic
Visitors arriving at your website by typing the URL directly or via bookmark, rather than clicking a link from search or social.
How to track: Google Analytics shows direct traffic by week. Compare campaign weeks against pre-launch baseline.
Why it matters: TV ad viewers often type your URL directly later rather than clicking a search result. A direct traffic lift during the campaign window is a second cross-channel lift signal that captures TV-driven activity that didn't go through search.
What "good" looks like: 10-25% direct traffic lift during active CTV flights for most local businesses. Lifestyle and consumer brands often see stronger lift than service businesses.
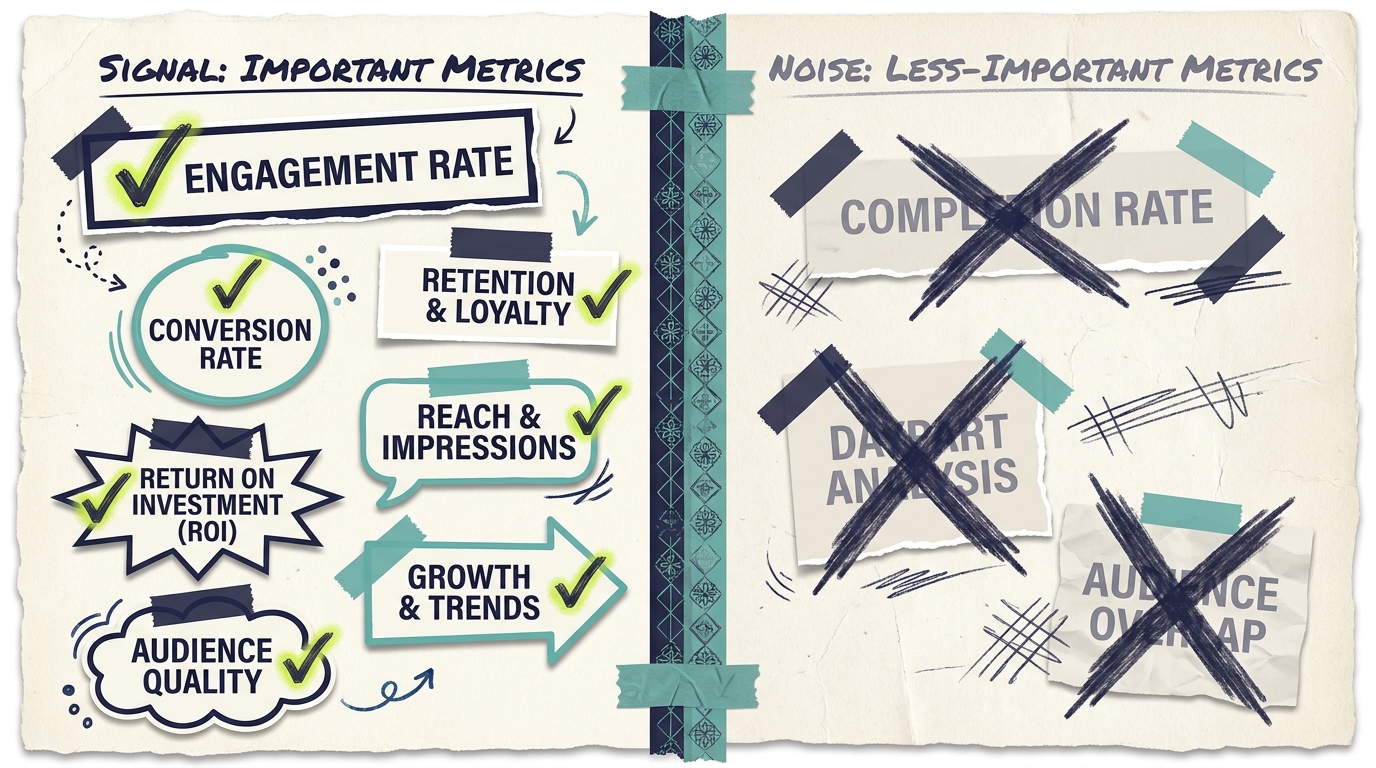
Three metrics to ignore (or downweight) at small-business scale
Several metrics show up prominently on dashboards but aren't worth meaningful decision-making weight for small-budget campaigns.
Completion rate. The percentage of viewers who watched your 30-second ad all the way through. CTV completion rates on premium inventory are typically 90-98%. The number is interesting but not actionable; if your completion rate is suddenly under 85%, contact platform support, but most of the time you can safely ignore it.
Daypart distribution. When during the day your ads ran. Mildly interesting for content businesses (restaurants, hospitality, events), nearly irrelevant for most service businesses. Unless you have a clear daypart hypothesis (e.g., a restaurant pushing dinner traffic), spend your dashboard time elsewhere.
Audience overlap with other channels. Some platforms report on overlap with Meta, Google, and other inventory. Interesting at scale; not actionable for most small business decisions. Worry about cross-channel coordination through synchronized creative and timing, not through dashboard overlap data.
How to read the metrics together
The metrics matter most when read as a system, not in isolation. A few common patterns:
Strong lift over baseline, healthy frequency, good geographic match: the campaign is working as designed. Scale modestly (25-50% budget lift) and continue.
Modest direct attribution, strong branded search and direct traffic lift: TV is doing its work, but most of the conversion is happening through other channels. Pre/post baseline measurement captures the lift; cross-channel signals confirm it.
High frequency (over 7), modest conversion lift: you're saturating the same households without compounding. Widen geographic targeting to bring frequency to 4-5.
Low frequency (under 2), modest conversion lift: your audience isn't seeing the ad enough. Tighten geographic targeting to concentrate impressions and build frequency.
Strong direct attribution, weak cross-channel signals: unusual pattern. Usually indicates a hard-CTA creative that's converting on direct response but not building broader brand recognition. Mix in some softer-CTA brand creative to broaden the campaign's effect.
Spend pacing ahead of schedule: demand for your inventory is high. Decide whether to add budget to maintain delivery or accept early burn-out and supplement other channels in the final weeks.
Spend pacing behind schedule: delivery is constrained. Usually targeting too narrow. Either widen targeting or extend the campaign window.
A 15-minute weekly review framework
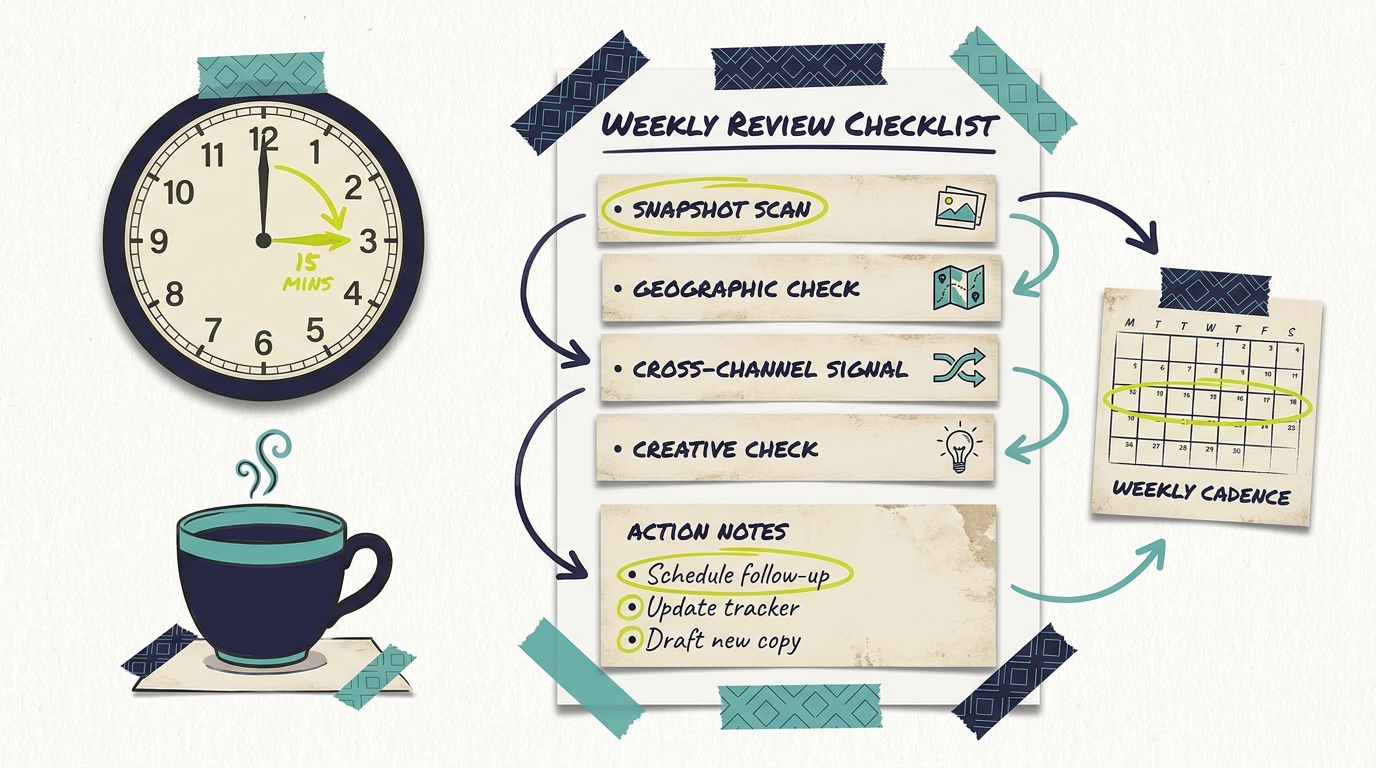
The small business owners who get the most out of their TV campaigns aren't checking dashboards six times a day. They're running a focused 15-minute review once a week and making at most one or two adjustments based on it.
A practical framework for your weekly review:
Minute 0-3: Snapshot scan. Look at total impressions, total spend, average CPM, average frequency, and reach. Note any number meaningfully different from last week.
Minute 3-6: Geographic distribution check. Are impressions landing where your customers are? If 80%+ are in your real service area, hold steady. If less, plan a targeting adjustment.
Minute 6-9: Cross-channel signal check. Branded search, direct traffic, total inquiries vs baseline. Are the signals trending up or holding? If signals are weak after 4-6 weeks, consider creative or targeting changes.
Minute 9-12: Creative-level check. If running multiple creatives, look at conversion rate by creative. Plan a creative-level decision (pause weakest, scale winner) if there's clear separation.
Minute 12-15: Note one or two actions. No more than two adjustments per week. Most campaigns succeed through patient observation, not frequent tinkering.
When to optimize, when to hold
A pattern we see frequently: small business owners over-optimize their campaigns. Every weekly dashboard glance produces a new adjustment, which adds noise faster than it adds improvement.
The right cadence:
Weeks 1-2: Don't optimize. The platform needs settling time. Watch and learn.
Weeks 3-4: First targeting adjustment if geographic leakage is meaningful. Otherwise hold.
Weeks 5-8: Creative-level decisions. Pause clear losers, scale clear winners. Frequency-driven targeting tweaks if needed.
Weeks 9-12: Performance reading and scaling decisions. Most adjustments happen at the campaign's end-of-cycle decision point, not throughout it.
The owners who get the most out of their campaigns make 4-6 total adjustments across a 90-day cycle, not 15-20.
Common questions answered
What's the single most important TV campaign metric for a small business?
Total conversions or inquiries over pre-launch baseline. Direct attribution is incomplete; the lift over baseline is the truer measure. Capture 4-6 weeks of pre-campaign baseline data before launch, then compare campaign weeks against it.
Why is my campaign showing strong frequency but weak conversion?
Most likely cause: frequency that's saturating already-converted households without reaching new prospects. Check geographic distribution; you may be running too tightly. Second likely cause: creative isn't compelling enough to drive action even at appropriate frequency. Test creative variations.
Should I worry if my CPM is higher than the $15-35 typical range?
Briefly. Elevated CPM usually signals demand pressure (Q4 holidays, election windows, major events) or tight inventory in your targeting. If CPM persists above $35 for more than a few weeks and isn't producing proportional conversion lift, talk to platform support about inventory optimization.
How long should I wait before judging whether my campaign is working?
Plan for at least 60-90 days. Two-week judgments produce false negatives because TV's lift builds across multiple cycles of impression and recall. Most clean reads happen at the 90-day mark when pre/post baseline comparisons stabilize.
Should I track competitor activity?
Lightly. Knowing whether competitors are running their own TV is useful for context, but most small business owners over-invest in competitor watching at the expense of their own campaign optimization. Focus 90% of your dashboard time on your own metrics; 10% on competitive awareness.
Is direct attribution worth setting up if it captures only 30-50% of TV's impact?
Yes, because it captures something real. Use direct attribution as a floor for TV's contribution and cross-channel lift to estimate the rest. Together they produce a defensible total picture of campaign value.
What's the simplest measurement setup for a small business adding TV?
Three layers: a "how did you hear about us?" field on inquiry forms or registers (with TV as explicit option), a pre/post 4-week baseline for total conversions, and weekly Google Search Console pulls for branded search trends. That's 80% of what you need to measure TV cleanly.
Make metrics work for you
A TV campaign dashboard isn't a scoreboard. It's a decision tool. Each number exists to tell you whether to widen, tighten, refresh, or hold. The small business owners who get the most out of TV advertising are the ones who treat their weekly dashboard review as a coffee-and-data session: 15 minutes, one or two decisions, repeat.
The seven metrics in this guide cover what you need. The rest is noise. Focus on the signal, ignore the noise, and your campaign performance will compound month over month.