Ready in minutes
AI builds your ad from a single prompt

April 22, 2026
12.7%
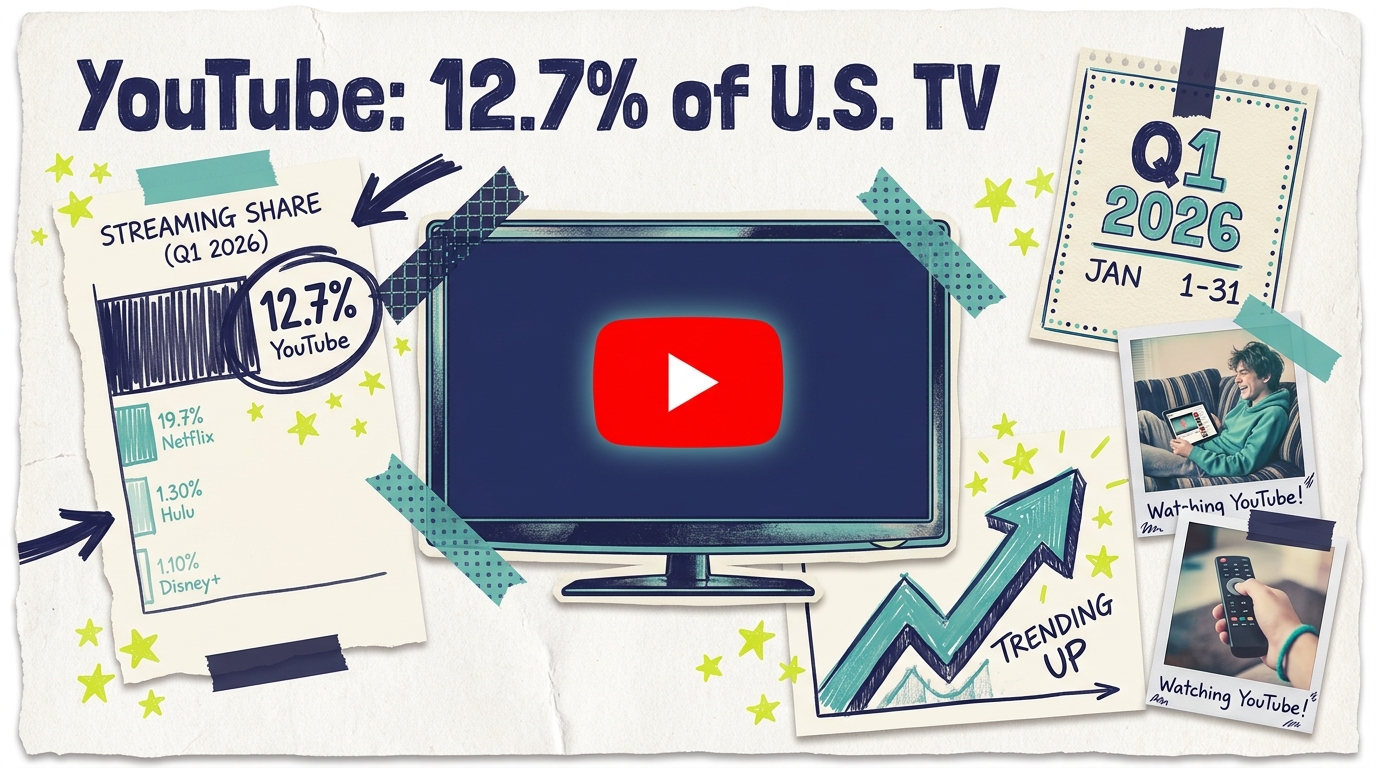
YouTube's share of U.S. TV viewing (Q1 2026)
#1
Largest single media entity on U.S. TV screens
47.0%
Total streaming share of U.S. TV, Jan 2026 (record)
YouTube entered 2026 as the largest single media entity on American television, then briefly lost the top spot in February when Super Bowl LX and the Milan-Cortina Winter Olympics pushed NBCUniversal-Versant ahead. The two-month swing tells a useful story about YouTube's structural position in 2026: a steady baseline large enough to lead most months, with event-driven programming on traditional TV still capable of disrupting the ranking temporarily.
For small businesses thinking about TV advertising in 2026, YouTube's share is the number that explains why "TV advertising" no longer means "cable and broadcast." This post breaks down YouTube's share of U.S. TV viewing through Q1 2026 using Nielsen's publicly released Gauge data, and translates what the numbers mean for local advertisers.
In January 2026, YouTube held 12.7% of total U.S. TV viewing time according to Nielsen's The Gauge. That was the largest share of any individual media property.

In February 2026, YouTube held its share at 12.7% but was surpassed by NBCUniversal-Versant (which reached 13.1% in Nielsen's Media Distributor Gauge) thanks to Super Bowl LX on NBC and the Winter Olympics running February 6-22 on NBC and its affiliated networks. YouTube's share didn't decline; NBCU's share temporarily expanded.
Total streaming share was 47.0% in January 2026 (a record for The Gauge per Nielsen's press release) and pulled back to 41.9% in February as the tentpole events drew viewers to linear TV. Broadcast rose from 21.2% in January to 21.7% in February. Cable dropped to 20.0% in February.
Nielsen has delayed the release of the March 2026 Gauge report, citing methodology disputes. MediaPost reported on March 20, 2026 that the recalibrated Gauge has been postponed to later in 2026. As a result, the full Q1 2026 picture relies on January and February data.
Nielsen's The Gauge is a monthly report that measures time spent viewing across the biggest distributors of TV content in the United States. The Gauge combines Nielsen's traditional panel-based measurement of linear TV with its streaming measurement to produce a single view of how total TV viewing time is split. The Gauge launched in 2021 and has been published monthly since.
The Gauge reports two distinct views. The first is the "Gauge" itself, which breaks total TV viewing time into categories (broadcast, cable, streaming, and other). The second is the "Media Distributor Gauge," which breaks TV viewing time down by the company that distributes the content, so YouTube as a platform appears separately from NBCUniversal as a media distributor.
Several aspects of The Gauge methodology are worth understanding:
Viewing time, not reach: The Gauge reports total viewing minutes, not the number of households reached. A platform with a smaller audience that watches for longer can hold more share than a platform with a larger casual audience.
TV screens only: The Gauge measures viewing on actual television screens. Mobile and desktop viewing are generally excluded, which means YouTube's mobile audience doesn't factor into its TV share figure.
Monthly cadence: The Gauge is a monthly snapshot. Single-month figures can be influenced by seasonal events, sports schedules, and specific program launches.
Nielsen's DASH methodology update: Nielsen is rolling out a new measurement approach called DASH (Device Activity and Streaming Home) that incorporates additional household data. Streaming platforms have raised concerns that DASH reduces their reported share. Nielsen has paused full DASH implementation pending review, and the January and February 2026 reports use Nielsen's consistent pre-DASH methodology.
For advertisers, the practical takeaway is that The Gauge represents the industry's consensus view of where American TV viewing time goes. When you're comparing platforms or planning budget allocation, Nielsen's figures are the common reference point most buyers and sellers use.
YouTube's 12.7% share means that for almost any audience advertisers want to reach on TV screens, YouTube is part of where that audience is. Viewers under 35 in particular have concentrated their TV viewing on YouTube to a degree that traditional broadcast and cable can no longer match.

A few practical implications for small business advertisers:
YouTube inventory should be part of your CTV plan. Any streaming campaign that excludes YouTube misses a large share of available TV attention.
Younger audiences skew heavily toward YouTube. If your customer base is under 35, YouTube typically delivers a larger share of their TV time than any other platform.
CTV viewing of YouTube is substantial. YouTube now reaches TV screens through streaming devices, smart TVs, and game consoles. A YouTube ad in 2026 is, for many viewers, a TV commercial that happens to play on YouTube.
Local advertisers can access YouTube through bundled CTV platforms. Google Ads offers direct YouTube buys; all-in-one platforms bundle YouTube alongside Hulu, Peacock, Tubi, and other streaming apps.
Industry estimates place YouTube CTV CPMs in the $15-$25 range on average, generally below premium SVOD services but above some FAST platforms. Actual CPMs vary widely by targeting, creative format, content category, and demand. Before committing to a specific budget, request quotes from the platforms or bundled CTV services you plan to use.
Small businesses have three practical paths to buy YouTube advertising:
Google Ads directly. This is the self-serve approach that YouTube's parent company offers. You create a Google Ads account, build video campaigns, upload your creative, and bid on placements. Google Ads offers several YouTube campaign types (standard video, video reach, video action, and Performance Max for CTV). Minimum budgets are low (campaigns can run on $10-$50 per day), but the platform requires time to learn and ongoing optimization.
Bundled CTV platforms. Many self-serve CTV advertising platforms include YouTube in their aggregated inventory alongside Hulu, Peacock, Tubi, Roku Channel, and other streaming apps. This approach simplifies the buying process (one account, one campaign, one invoice) and is typically designed for small advertisers who don't want to manage multiple platforms.
Agencies and direct sales. Larger campaigns can be placed through advertising agencies or through YouTube's direct sales team (for brands with meaningful budget). This path adds cost but adds expertise and access to premium placements.
For most local small business advertisers, the bundled CTV approach is the simplest starting point. It provides YouTube reach alongside the other streaming platforms most viewers use, all through a single campaign management interface.
YouTube delivered through CTV behaves differently than YouTube on mobile. A few principles apply:
Use 15 or 30 second creative for CTV. Most CTV inventory runs in these standard lengths. Shorter 6-second bumper ads work in some placements but aren't the default for CTV.
Design for sound-on viewing. CTV viewers almost always have sound enabled (unlike mobile social video). Strong audio design, clear voiceovers, and music bed selection matter more on CTV than on mobile.
Keep branding visible throughout the spot. CTV viewers can't click, so brand recognition needs to come from the spot itself. Don't wait until the last 3 seconds to brand the ad.
Plan for horizontal 16:9 format. CTV is a horizontal medium. Vertical creative gets letterboxed on TV screens, which wastes screen space and looks amateur.
Match creative tone to content environment. YouTube's content environment includes everything from news to gaming to cooking. Creative that feels native to your target content category tends to perform better than generic commercial creative.
For small businesses without cinematic production budgets, AI-powered ad generation tools can produce polished 30-second spots from a website URL in minutes. Platforms like Adwave are designed specifically for small advertisers who need broadcast-quality creative without large production commitments.
Knowing YouTube leads TV viewing share is useful. Acting on it is where advertising wins happen.
Include YouTube in every streaming campaign. Don't use a CTV platform that excludes YouTube unless the campaign has a specific reason to.
Use content-category targeting where available. YouTube's creator ecosystem lets advertisers target specific content verticals (home improvement, cooking, music, automotive, etc.) for audience-relevant placement.
Match creative to TV-screen viewing. Most YouTube viewing on CTV is horizontal 16:9. Traditional 30-second TV creative performs well.
Run complementary creative on Shorts. If you're using YouTube for broader reach, vertical creative for Shorts lets you reach audiences who primarily watch short-form.
Budget for frequency caps. YouTube viewers see more ads per session than most streaming platforms. Plan creative rotation to avoid burnout.
CTV advertising measurement is different from search or social advertising. YouTube viewers on TV screens rarely click through, so clickthrough rate isn't a useful metric. Instead, advertisers typically track:
Reach and frequency: How many unique households saw your ad, and how many times on average. This is the basic currency of TV advertising.
View-through rate (VTR): The percentage of ad impressions that viewers watched to completion. Strong VTR on CTV runs 90%+ because the format doesn't allow skipping on most placements.
Brand lift: Changes in brand awareness, consideration, or preference among audiences exposed to your ad. Google Ads offers Brand Lift Studies for larger campaigns; third-party measurement services offer similar capabilities.
Downstream conversion: Website traffic, branded search volume, store visits, or sales among audiences exposed to your ad. This requires a measurement framework that ties exposure to outcome.
Incrementality: The lift in conversions attributable specifically to YouTube advertising versus what you would have gotten from other channels. Harder to measure but more accurate than last-click attribution.
Small businesses running YouTube campaigns should track at least reach, frequency, view-through rate, and branded search lift as baseline measurement. Allocate 30-60 days to measurable results before drawing conclusions.
The 2026 TV advertising market is going through structural reorganization. Comcast spun off its cable networks (MSNBC, CNBC, E!, Syfy, USA, Oxygen, and Golf Channel) into a separate company called Versant in late 2025. Warner Bros. Discovery is exploring similar separation. Disney continues to review its ABC and cable portfolio.
These corporate moves reflect the same structural shift the Nielsen Gauge data shows every month: streaming viewing is growing, cable viewing is declining, and broadcast is stable. Inside streaming, YouTube's share is the largest. That shift is driving roughly $37.95 billion in projected U.S. CTV advertising spending in 2026 (eMarketer's December 2025 forecast), up 14.5% year-over-year. eMarketer's forecast also projects CTV advertising to surpass linear TV advertising by 2028.
For local advertisers, the structural direction suggests continuing to shift TV budget toward CTV, with YouTube as one of the core platforms in the plan.
Nielsen's Gauge figures are the industry's best public view of TV viewing, but they have limitations worth remembering:
The Gauge measures aggregate viewing time, not advertising reach specifically. Total viewing time includes both ad-supported and ad-free viewing. Advertisers can only reach the ad-supported portion of YouTube's audience.
Monthly figures can reflect temporary programming effects. February 2026's NBCU-Versant surge was driven by specific events. Q1 averages would smooth the effect, but single-month figures can mislead.
YouTube's audience composition varies by content category. The 12.7% headline figure is an average across all YouTube content. Specific categories (sports, news, creator content, music) have different audience demographics and different advertising value.
Individual platform figures don't capture ad load. Netflix caps ad load lower than YouTube, which means Netflix CPMs are higher but Netflix impressions are scarcer. Advertisers comparing platforms should think about both viewing time and inventory availability.
Advertisers using The Gauge should treat it as a directional signal rather than a precise prescription. Use it to understand where audiences are moving, then plan campaigns based on more granular platform-level targeting data.
Is YouTube's share really bigger than Netflix's?
Yes, by a meaningful margin. In January 2026, YouTube held 12.7% of total TV viewing versus Netflix's 9.0%, per Nielsen's The Gauge.
Why did NBCUniversal beat YouTube in February 2026?
The Super Bowl LX on NBC (February 8) and the Milan-Cortina Winter Olympics (February 6-22 on NBC and its networks) concentrated viewing on NBC during February. NBCU-Versant combined reached 13.1% of total TV viewing for the month, temporarily ahead of YouTube at 12.7%. Outside major event windows, YouTube had led the Media Distributor Gauge for multiple months prior.
How do small businesses advertise on YouTube?
Two main paths: Google Ads for direct YouTube buying (requires YouTube-specific campaign setup), or all-in-one CTV platforms that include YouTube alongside other streaming apps. Platforms like Adwave let local advertisers create a 30-second TV ad from their website and run it across YouTube, Hulu, Peacock, and 100+ other streaming channels starting at $50.
Is the Nielsen Gauge the definitive measurement?
Nielsen's The Gauge is the most widely cited cross-platform TV measurement in U.S. media. Streaming platforms have raised concerns about methodology (particularly around Nielsen's DASH data integration), and Nielsen has delayed the recalibrated Gauge multiple times through early 2026. The January and February 2026 figures use Nielsen's consistent pre-recalibration methodology.
What's next for YouTube's share?
Industry analysts generally expect YouTube to continue growing share gradually, though at a slower pace than the rapid gains of 2022-2024. The February 2026 NBCU surge was event-driven and is expected to reverse once Super Bowl and Olympic programming exits the comparison window.
What's the difference between YouTube and YouTube TV?
YouTube is the main video platform with ad-supported free content, creator videos, and ad inventory accessible through Google Ads. YouTube TV is a separate subscription service that delivers live-TV channels (broadcast networks, cable channels, sports networks) through the YouTube app. Both are owned by Google/Alphabet, but they have different content, pricing, and ad inventory characteristics.
If you're a small business running TV advertising in 2026, YouTube's 12.7% share is a clear signal that streaming TV is where most audiences live. Local advertisers can access YouTube inventory directly through Google Ads or through bundled CTV platforms that aggregate YouTube, Hulu, Peacock, Tubi, and other streaming apps into a single campaign.

Adwave lets local advertisers create broadcast-quality 30-second TV ads from their website URL and run them across 100+ premium streaming channels, including YouTube, for as little as $50. See how it works.