Ready in minutes
AI builds your ad from a single prompt

August 07, 2025
Americans spend over $60/month on streaming services. Here's what that means for advertisers.
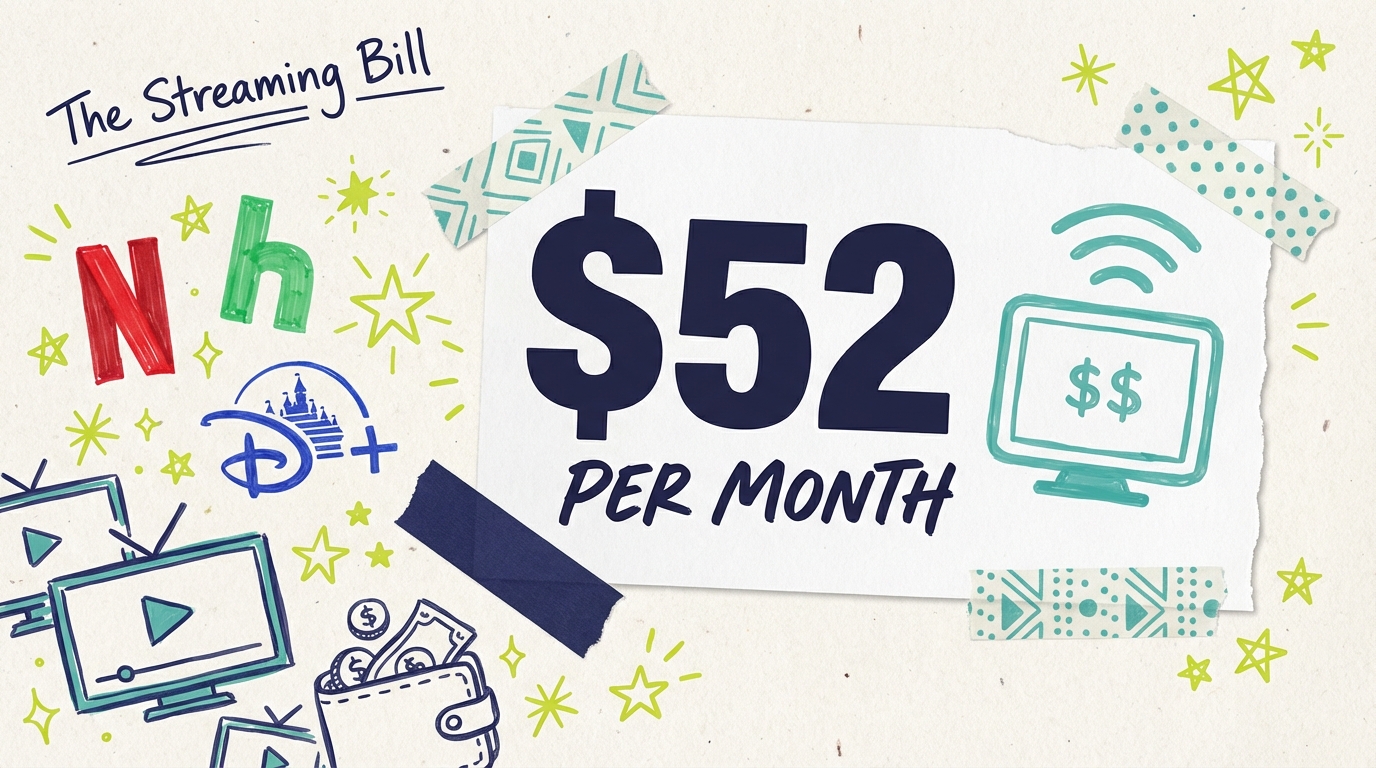
$52
Average monthly streaming spend per household (2025)
2.68
Average streaming subscriptions per household
18%
Year-over-year increase in streaming spending
The average American household now spends approximately $52 per month on streaming subscriptions, totaling around $620 annually, according to Reviews.org research. This represents an 18% increase from 2024, when the average was $42.38 per month according to The Wrap. For advertisers, these spending patterns reveal important insights about consumer behavior: Americans are investing more in streaming entertainment, subscribing to more platforms, and increasingly choosing ad-supported tiers to manage costs.
Consumer spending on streaming services fluctuates as households balance content desires against budget pressures. The 2025 increase reflects several market dynamics working together.
Key spending statistics (all sourced):
Average monthly spend (2025): $52/month per household (Reviews.org)
Average monthly spend (2024): $42.38/month, down 23% from 2023 (The Wrap)
Average subscriptions (2025): 2.68 services per household, up from 2.2 in 2024 (American Business Times)
Heavy spenders: Nearly 25% of U.S. households spend over $100 monthly on streaming and subscription services (MediaPost)
The 2024 dip in spending was attributed to "streaming fatigue" and economic pressures. The 2025 rebound reflects both price increases across platforms and consumers adding services rather than canceling. Interestingly, the growth in average subscriptions from 2.2 to 2.68 services accounts for much of the spending increase.
Subscription count varies by measurement:
Different research methodologies produce different subscription counts:
Parks Associates: Nearly 6 video services on average, $109 monthly (TV Technology)
Bango/3Gem: 5.4 subscriptions, with 2 being bundled (MediaPost)
Kantar: 4.1 paid streaming services (SpendMeNot)
Reviews.org: 2.68 services per household (Reviews.org)
The variation stems from how researchers define "streaming service" (some include music, gaming, and fitness), whether they count free services, and whether bundled services count as one or multiple subscriptions. The key insight: most households subscribe to multiple services, creating substantial monthly entertainment expenses.

Understanding where streaming money goes reveals opportunities for both consumers and advertisers.
Streaming services now offer multiple pricing tiers, and the tier mix affects total household spending:
Premium streaming (ad-free) pricing in 2025, according to [Tom's Guide](https://www.tomsguide.com/entertainment/streaming/what-streaming-costs-in-2025-the-price-of-netflix-disney-plus-max-and-more):
Netflix Premium: $24.99/month (4K, extra members)
Max Ultimate: $20.99/month (4K, ad-free)
Disney+ Premium: $15.99/month (ad-free)
Apple TV+: $9.99/month (no ads, 6 devices)
Ad-supported tier pricing:
Netflix Standard with Ads: $7.99/month
Max with Ads: $9.99/month
Disney+ Basic: $9.99/month
Peacock Premium: $7.99/month (limited ads)
The $15-20 price gap between ad-supported and ad-free tiers is driving significant adoption of lower-priced options. For advertisers, this means more premium streaming inventory as price-conscious consumers choose ad-supported tiers.
Not all households spend equally. Bango research via MediaPost reveals significant segmentation:
Heavy streamers (25% of households): Over $100/month on streaming and subscriptions
Moderate streamers: $40-$80/month, typically 2-4 services
Light streamers: Under $30/month, often using one primary service plus free options
This segmentation matters for advertisers. Heavy streamers represent engaged entertainment consumers with demonstrated willingness to pay for content. Light streamers often use ad-supported services, making them more reachable through advertising.
The cost comparison between streaming and cable reveals why cord-cutting continues:
Monthly costs in 2025:
Cable TV average: $101/month, up 14% from 2024 (American Business Times)
Cable premium packages: $147+ including sports and equipment fees (Cable Papa)
Streaming average: $52/month (Reviews.org)
Internet service: $68/month average (American Business Times)
Even accounting for internet costs (required for streaming), the average streaming household saves approximately $30-50 per month compared to cable. This savings is the primary driver of the ongoing shift to streaming. Over a year, that's $360-600 in savings, which explains why 72% of U.S. households have cut the cord.
Live TV streaming alternatives:
For viewers who want live TV channels without cable, virtual MVPDs bridge the gap according to Tom's Guide:
YouTube TV: $82.99/month (unlimited DVR)
Hulu + Live TV: $81.99/month (includes Disney+ and ESPN+)
Sling TV: Starting at $45/month
These services cost less than cable while offering similar live programming, further accelerating cord-cutting.

Consumer streaming spending patterns create distinct advertising opportunities.
As streaming costs rise, more consumers choose ad-supported tiers. According to Business Standard, over 50% of new Netflix sign-ups now choose the ad-supported plan. This creates growing premium ad inventory.
For advertisers, the implication is clear: streaming ads now reach mainstream consumers, not just budget-conscious viewers. When Netflix, Disney+, and Max all offer ad-supported tiers, advertisers can reach premium content viewers at scale.
The households most price-sensitive about streaming are also most likely to use ad-supported services. This means advertising can reach cost-conscious consumers who might otherwise be unreachable through subscription-only platforms.
Local businesses benefit particularly from this dynamic. A restaurant targeting families looking for value can reach those same budget-minded consumers through ad-supported streaming, delivering TV-quality advertising to an audience predisposed to seeking deals.
When pitching TV advertising to small business owners, the $52 average streaming spend provides useful context. Consumers are already investing $52/month in entertainment on the same screens where your ads appear. Your $50 minimum CTV budget buys access to those engaged viewers, essentially the same amount households invest monthly in their streaming entertainment.
This reframing helps business owners understand CTV advertising value. Consumers value streaming highly enough to spend $620 annually. Advertising on those platforms places your message alongside content viewers actively chose to pay for.
Rising streaming spending creates actionable opportunities for advertisers.
With streaming prices rising, ad-supported tiers grow more attractive. Platforms like Adwave give you access to this growing inventory across 100+ premium channels including ad-supported tiers on major streamers.
Streaming viewers are entertainment-focused and generally receptive to relevant advertising, especially during ad breaks in content they chose. Unlike cable viewers who may be channel surfing, streaming viewers are deliberately engaged with specific content.
Unlike cable, streaming advertising allows precise geographic targeting. A home services business can target their exact service radius rather than paying for an entire DMA. This means your streaming advertising dollars work harder than cable ever could.
In your advertising creative, consider acknowledging the value-conscious mindset of streaming viewers. They've already demonstrated financial savvy by choosing streaming over cable. Appeals that resonate with smart spending can perform well with this audience.
Streaming spending data reveals a mature market still finding its equilibrium.
At what point do households say "enough"? The data suggests we're testing that ceiling. The 23% spending drop in 2024 showed price sensitivity exists. The 18% rebound in 2025 shows that sensitivity is elastic. Households reduce streaming during economic pressure but return when budgets allow.
For the streaming industry, this suggests ongoing price increases will eventually hit resistance. For advertisers, it suggests ad-supported tiers will continue growing as consumers seek ways to maintain access while managing costs.
Major players are increasingly offering bundles (Disney+/Hulu/ESPN+, Max/Discovery+). These bundles can increase apparent subscription counts while offering value. The Bango research finding that 2 of the average 5.4 subscriptions are bundled reflects this trend.
Bundles benefit advertisers by consolidating audiences and simplifying media buying. A bundle that includes multiple ad-supported services creates larger addressable audiences.
FAST (Free Ad-Supported Streaming TV) services like Tubi, Pluto TV, and Roku Channel don't appear in most subscription spending data because they're free. But they're significant for advertisers. Tubi, for instance, captures meaningful viewing share with zero cost to consumers.
For small business advertisers, FAST services represent pure opportunity: reach engaged viewers without competing against subscription fatigue.
Streaming spending patterns vary significantly by age. Younger households have grown up with streaming as the default entertainment option. They've never experienced the bundle economics of cable and approach streaming as a utility, subscribing and unsubscribing fluidly based on content needs.
Older households often maintain both cable and streaming, resulting in higher total entertainment spending. This "stacking" behavior creates advertising opportunities: these households are reachable through both traditional and streaming channels.
For advertisers targeting specific age demographics, understanding these patterns helps optimize channel allocation. A business targeting consumers over 55 might still benefit from traditional TV, while a business targeting younger demographics should focus streaming investments.
Streaming spending also varies by geography. Urban households tend to have higher streaming spending, reflecting both higher incomes and better internet infrastructure. Rural households may rely more heavily on traditional TV due to bandwidth limitations, though this is changing as broadband access expands.
For local businesses, these patterns matter. A business in a metro area likely reaches more of its target audience through streaming than a rural business would. Geographic targeting in CTV advertising helps optimize spend by focusing on areas where streaming penetration is highest.
Industry analysts see the spending trends as indicative of a maturing market.
Parks Associates notes that "streaming subscriptions have reached 91% of U.S. internet households," indicating near-saturation in terms of adoption. Future growth must come from increased spending per household rather than new adopters.
American Business Times reports that total annual U.S. media spending has reached $3,350 per household, with streaming representing an increasingly significant portion. This spending demonstrates consumer commitment to video entertainment.
The MediaPost/Bango research emphasizing that 25% of households spend over $100/month on streaming suggests a "super-user" segment that values entertainment highly and represents a premium advertising audience.
Industry observers also note the increasing importance of bundling strategies. Disney's combined Disney+/Hulu/ESPN+ bundle and Warner Bros. Discovery's Max consolidation represent attempts to increase per-household spending while providing value. These bundles create larger addressable audiences for advertisers and simplify the media buying process.
The shift toward ad-supported tiers has been faster than many expected. When Netflix launched its ad tier in late 2022, some questioned consumer appetite. The rapid adoption, now over 50% of new signups, validated the strategy and prompted other platforms to accelerate their own ad-supported offerings. For the advertising industry, this represents the largest expansion of premium TV inventory in decades.

Yes, for most households. The average $52/month streaming bill is roughly half the $101/month average cable bill, according to Reviews.org and American Business Times. Even adding internet costs ($68/month average), streaming households spend less for entertainment. The savings grow if you choose ad-supported tiers.
This varies by measurement methodology. Reviews.org reports 2.68 services, while Parks Associates counts nearly 6. The difference depends on whether free services, bundled services, and non-video subscriptions are included. Most households have 2-4 paid streaming video services.
Yes. According to Tom's Guide, most major streaming services have raised prices in 2025. Netflix Premium is now $24.99, Max Ultimate is $20.99, and even ad-supported tiers have seen modest increases. This price pressure is driving more adoption of ad-supported tiers.
The Wrap attributed the 23% decline to "streaming fatigue" and economic pressures. Households consolidated subscriptions, dropped services they weren't using, and became more deliberate about their entertainment spending. The 2025 rebound suggests this was a temporary adjustment rather than a permanent shift.
Yes. Unlike traditional TV, streaming advertising is accessible to businesses of all sizes. Platforms like Adwave enable campaigns starting at $50, running across 100+ premium streaming channels. You don't need the budget of a national brand to reach streaming audiences.
Research suggests ad-supported viewers are equally engaged with content. They've made an active choice to watch with ads in exchange for lower costs. For advertisers, this means reaching engaged viewers who have demonstrated price sensitivity, making them potentially responsive to value-oriented messaging.
For context, the $52/month average streaming spend exceeds what many households spend on other entertainment categories. A monthly movie theater visit for a family of four can cost $60-100. A cable sports package alone often exceeds $30/month. Streaming represents substantial entertainment value, delivering unlimited content for a predictable monthly cost.
The ad-supported tier adoption varies by platform. Netflix reports that over 50% of new sign-ups choose ad-supported, according to Business Standard. Disney+ and Max have seen similar adoption patterns for their ad tiers. Industry-wide, ad-supported subscriptions represent a growing share of total subscriptions as price sensitivity increases.
Key statistics on American streaming spending (all sourced):
Average monthly streaming spend (2025): $52/month (Reviews.org)
Average monthly streaming spend (2024): $42.38/month (The Wrap)
Year-over-year change: +18% from 2024 to 2025 (Reviews.org)
Annual streaming spending: ~$620 per household (Reviews.org)
Average subscriptions: 2.68 services per household (Reviews.org)
Heavy spenders: 25% spend $100+/month (MediaPost/Bango)
Average cable cost (2025): $101/month (American Business Times)
Netflix Premium price: $24.99/month (Tom's Guide)
Netflix ad tier sign-ups: 50%+ of new subscribers (Business Standard)
Streaming household penetration: 91% of U.S. internet households (TV Technology/Parks Associates)
Americans invest $52/month in streaming entertainment. Your advertising can appear alongside the content they're paying for, delivering TV-quality reach at budgets that work for small businesses.
Adwave makes streaming TV advertising accessible. Create your commercial from your website in minutes, set geographic targeting for your service area, choose a budget starting at $50, and reach viewers across 100+ premium streaming channels.
The audience is already watching. Make sure they see your message.