Ready in minutes
AI builds your ad from a single prompt

October 13, 2025
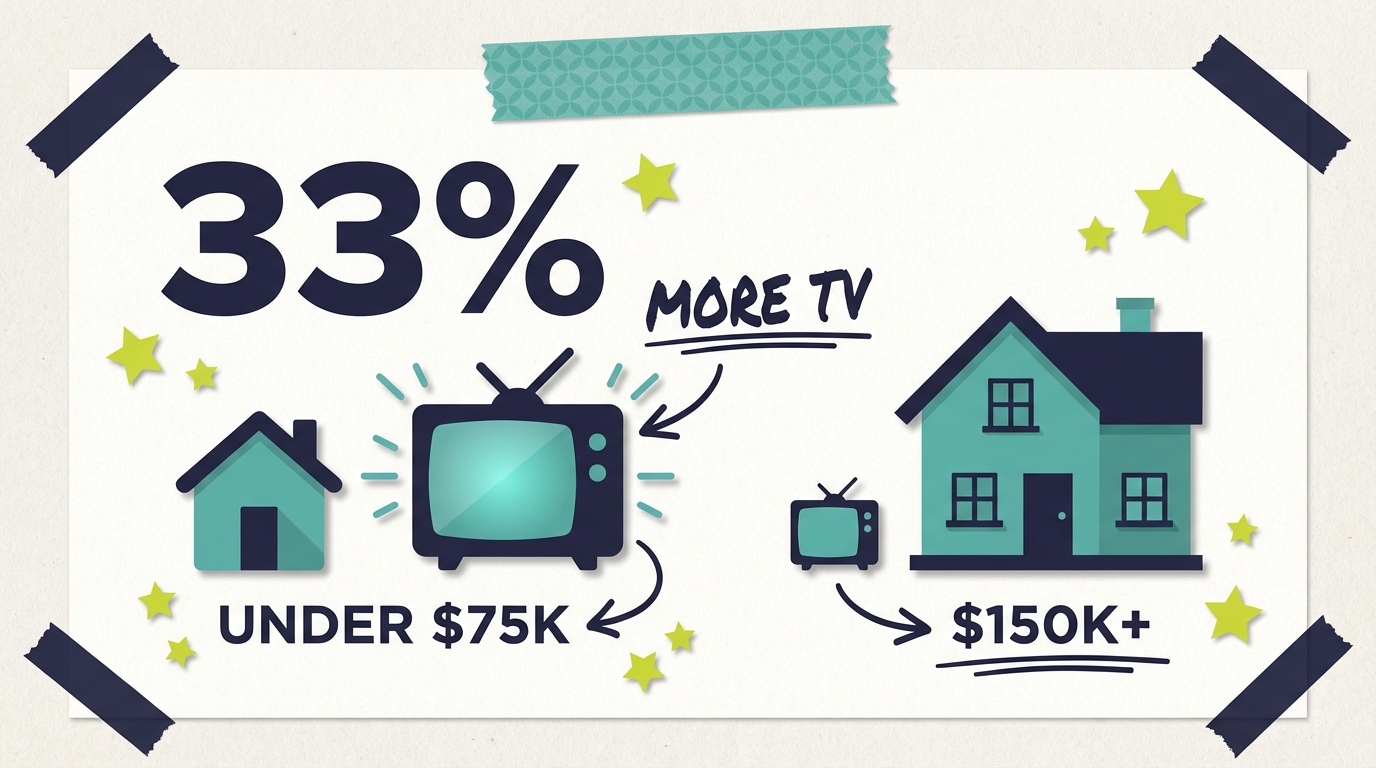
33%
More likely to be heavy TV viewers (under $75K income)
$509/yr
Affluent household video subscription spending
75%+
Middle/lower income adults who stream
Lower-income households watch significantly more television than higher-income households, according to Nielsen research. Americans earning under $75,000 annually are 33% more likely to be heavy TV viewers, while those earning $150,000 or more are 43% less likely to watch TV heavily (LinkedIn/Industry Analysis, 2025). This inverse relationship between income and TV viewing time creates distinct advertising opportunities across income segments, with higher earners concentrating viewing on premium streaming while lower earners maintain stronger relationships with traditional TV.
The relationship between household income and television consumption runs counter to what many advertisers assume. Despite higher-income households having more devices, streaming subscriptions, and content options, they actually spend less time watching TV than their lower-income counterparts. This pattern has remained consistent across years of Nielsen measurement and reveals important truths about how different economic segments relate to television.

Nielsen's Total Audience Report found that while high-income households own more devices and services across every category measured, lower-income households that have these devices use them significantly more. Adults in homes earning less than $25,000 who have access to connected devices spend more hours watching than adults in homes earning over $75,000 with the same devices. The disparity holds across traditional TV, streaming services, and connected devices.
The intensity of this viewing gap becomes clearer when examining heavy TV watchers. Americans earning under $75,000 are 33% more likely to fall into the heavy viewing category. On the opposite end, Americans earning $150,000 or more are 43% less likely to be heavy TV watchers. This creates a viewing time spectrum where income inversely correlates with hours spent in front of screens.
Pew Research Center surveys from July 2025 show that streaming service usage does vary by income, with higher earners more likely to stream. However, the gap is smaller than many expect. While adults with higher incomes are most likely to watch streaming services, approximately 75% or more of those with middle or lower incomes also stream content. The difference lies more in how much time each group spends viewing rather than whether they view at all.
What explains this pattern? Several factors contribute. Higher-income adults typically work longer hours, leaving less discretionary time for television viewing. They're also more likely to have varied entertainment options competing for attention, from dining out to travel to live events. Lower-income households may have fewer alternative entertainment options, making television a more central part of daily leisure time. The cost efficiency of television as entertainment, with cable or streaming providing thousands of hours of content for a fixed monthly fee, makes it particularly attractive for budget-conscious households.
Cable and satellite subscription patterns add another dimension to the income picture. While cord-cutting has accelerated across all income groups, higher-income households haven't necessarily abandoned pay TV at higher rates. According to industry data, households earning $100,000 or more actually maintain cable subscriptions at rates that surprised analysts, often because bundled packages include internet service or because time-shifting capabilities appeal to their schedules.
Understanding TV viewing by income requires examining both the time spent watching and the platforms used across different economic segments.

The time disparity between income groups is substantial. Lower-income households average significantly more daily viewing hours than their higher-income counterparts. Nielsen data shows adults in households earning under $50,000 consistently log more weekly hours across all measured platforms than those in households above that threshold.
Within multicultural segments, income proves to be an equalizing factor. Adults of all races and ethnicities in the same income bracket show similar device ownership and usage patterns. For example, among households earning under $50,000, Black adults averaged over 33 monthly hours with multimedia devices, Hispanic adults about 27 hours, and Asian-American adults about 41 hours. In households earning over $50,000, all three groups saw reduced usage: 20 hours for Black households, 19 for Hispanic households, and 25 for Asian-American households.
This pattern suggests that income level may be a stronger predictor of TV viewing behavior than other demographic factors. Marketers who target solely based on age, ethnicity, or geography without considering income may miss important nuances in viewing behavior.
Higher-income households show distinct platform preferences that differ from lower-income viewers. Ipsos Affluent Intelligence research on households earning $125,000 or more reveals that affluent viewers spend $509 per year on video subscriptions compared to $418 for the general population. They're also willing to spend up to $591 per year, indicating room for premium service upsells.
Streaming adoption shows income-based patterns as well. While streaming is nearly universal across income groups, higher earners are more likely to maintain multiple subscriptions and access ad-free tiers. Lower-income households show higher adoption of ad-supported streaming services, including FAST platforms like Pluto TV and Tubi, where they can access content without subscription fees.
Cable retention patterns reveal that wealthy households haven't abandoned traditional TV as dramatically as headlines suggest. Marketing Charts research shows wealthy households maintain their share of primetime TV viewing while also adopting streaming heavily. The key difference is that affluent viewers time-shift more, using DVR to watch programming on their schedules rather than live.
Content preferences diverge meaningfully across income levels, creating opportunities for targeted advertising strategies. Ipsos found that affluent viewers particularly over-index on dramas, especially political dramas, live sports, movies, and children's programming. These preferences align with programming available on premium networks and streaming services, suggesting that content quality and prestige matter more to affluent viewers than volume or variety.
Generational preferences within affluent audiences show additional patterns worth noting. Affluent millennials skew toward drama, comedy, and reality programming. Affluent Gen X over-indexes on movies and children's programming, reflecting family viewing patterns. Affluent boomers prefer news, documentaries, and foreign programming. Understanding these intersections of income and age allows for more precise targeting that goes beyond simple demographic categories.
News consumption shows a clear income correlation that creates valuable advertising opportunities. Higher-income viewers are more likely to watch news programming, particularly political news and business news. This creates valuable inventory for financial services, luxury goods, and B2B services that want to reach decision-makers during their preferred content. The context of news viewing also tends to create engaged, attentive audiences.
The income-viewing relationship creates both challenges and opportunities for advertisers. The conventional wisdom that TV advertising reaches primarily lower-income audiences isn't quite accurate, and understanding the nuances can improve campaign effectiveness significantly.

For businesses targeting affluent consumers, TV remains highly effective despite lower viewing hours among this demographic. Affluent households still watch primetime programming, particularly appointment viewing like live sports and prestige dramas. They're also highly reachable through streaming, where they over-index on premium platforms. The key is selecting inventory that aligns with affluent viewing patterns rather than assuming TV doesn't reach wealthy audiences.
Research from Ipsos shows that affluent viewers, particularly the influential segment they call "OTT Affluencers," are actually advertising-receptive. This contradicts the assumption that wealthy viewers simply skip or ignore ads. Among this group, 88% use paid video streaming, and they demonstrate strong willingness to engage with advertising that reaches them in premium content environments.
For businesses targeting mass market or value-conscious consumers, traditional TV and ad-supported streaming offer exceptional reach efficiency. The higher viewing hours among lower and middle-income households translate to more opportunities to build frequency with these audiences. A restaurant running local TV ads, for example, reaches its price-conscious target audience during the hours they're actually watching.
Local businesses particularly benefit from understanding income-based viewing patterns. Local TV advertising can be geographically targeted to reach specific income segments based on neighborhood demographics. A luxury home services company might focus on primetime in affluent ZIP codes, while a value-focused retailer might emphasize daytime and early fringe when price-conscious viewers are watching.
The streaming landscape offers income-based targeting that wasn't possible with traditional TV. Platforms like Roku, Amazon Fire TV, and connected TV services generally provide demographic targeting including household income proxies. This allows advertisers to reach their desired income segment specifically, whether that's affluent households for premium products or value-focused consumers for everyday goods.
Understanding income-based viewing patterns should inform both media planning and creative strategy. Here's how to apply these insights effectively.
Start by defining your target customer's income profile clearly. If you serve customers across income levels, consider whether different products or services appeal to different segments. A financial services company might promote wealth management to affluent viewers and savings accounts to middle-income households, using different inventory and creative for each.
For reaching affluent audiences, prioritize premium inventory despite lower overall viewing time. Live sports, particularly golf, tennis, and premium football matchups, index strongly with wealthy viewers. Prestige dramas on streaming platforms attract affluent audiences willing to pay for quality content. News programming, especially business and political news, reaches the informed, high-earning viewers that luxury and B2B brands seek.
Consider daypart strategy based on income targeting. Affluent viewers, with demanding professional schedules, concentrate viewing in primetime and weekend hours. Lower and middle-income audiences watch more consistently throughout the day, making daytime and early fringe valuable for reaching these segments cost-effectively.
For mass-market reach, streaming TV advertising on ad-supported platforms provides access to the heavy-viewing lower and middle-income segments. FAST channels and AVOD services attract viewers seeking value, making them efficient for brands with broad appeal or value positioning.
Creative considerations should reflect income targeting as well. Affluent viewers respond to sophistication, quality signals, and aspirational messaging. Value-focused viewers respond to price points, deals, and practical benefits. The same product might need different creative executions for different income targets.
Measurement approaches should account for income-based response patterns that differ meaningfully by segment. Affluent viewers may be more likely to research online before purchasing, making brand search volume and website attribution important metrics to track. They may also have longer consideration periods for major purchases. Lower-income viewers may respond more directly with phone calls or store visits, showing more immediate response patterns. Set up measurement frameworks to capture the response behaviors typical of your target income segment rather than applying one-size-fits-all attribution.
The relationship between income and TV viewing reflects broader economic realities that marketers should understand.
For higher-income Americans, time has become the scarce resource that money once was. Long work hours, demanding careers, and packed schedules leave less time for passive entertainment. The average executive or professional works well over 40 hours per week, with many in senior roles logging 50, 60, or even more hours. Add commuting, family obligations, fitness routines, and social commitments, and discretionary time shrinks dramatically. Television competes with a longer list of options for leisure time, from travel to fitness to dining to live events. When affluent viewers do watch TV, they're highly selective about what commands their attention and often time-shift to maintain control of their schedules.
Lower and middle-income households face different time constraints and trade-offs. While some work multiple jobs or long shifts, others have more available leisure time due to unemployment, underemployment, retirement, disability, or caregiving roles that keep them home. The structure of shift work may also create different viewing patterns, with time available during daytime hours that professionals rarely have free. Television provides affordable, accessible entertainment that fills this time effectively, delivering hours of engagement for minimal cost compared to alternatives.
Television offers extraordinary entertainment value per dollar spent. A cable subscription or streaming bundle providing thousands of hours of content for $50-150 per month represents one of the most cost-effective entertainment options available. Compare this to the cost of going to movies, attending sporting events, or dining out, and television's value proposition becomes clear. For budget-conscious households, this value equation makes TV viewing a highly rational leisure choice, delivering entertainment at a fraction of the cost of alternatives.
Higher-income households may not evaluate entertainment on the same value-per-hour basis that drives lower-income viewing patterns. They're more likely to pay premium prices for experiences, travel, live events, concerts, fine dining, and other entertainment options that compete directly with television for their limited discretionary time. The opportunity cost calculation differs when income is high but time is scarce, leading to different entertainment choices.
This income-viewing dynamic creates market inefficiencies that savvy advertisers can exploit. The assumption that TV primarily reaches downscale audiences leads some premium brands to underinvest in television, leaving valuable affluent inventory underpriced. Simultaneously, the strong viewership among lower and middle-income households makes TV highly efficient for mass-market brands.
The rise of ad-supported streaming expands these opportunities further. Affluent viewers increasingly accept advertising in exchange for lower subscription costs or free content, opening new inventory for premium brands. Value-conscious viewers embrace FAST channels enthusiastically, creating reach at lower CPMs than traditional TV historically offered.
Industry analysts have examined the income-viewing relationship extensively, yielding insights for marketers.
Nielsen's research team has documented the counterintuitive finding consistently. "We expected high-income households to own more devices, but we did not anticipate that low-income consumers of all devices had greater usage," noted Glenn Enoch, SVP Audience Insights at Nielsen. "The media behavior of low-income adults may be concentrated in fewer devices, resulting in more minutes of usage for the devices they own, while high-income adults distribute their time among more devices."
Ipsos Affluent Intelligence research emphasizes that despite lower viewing hours, affluent audiences remain crucial for the streaming category. "The Affluent are a crucial audience contributing to the OTT/streaming category," their analysis concluded. "Compared to the general population, they watch more [premium content], spend more and are more likely to embrace content choice and variety." This suggests that total hours matters less than content quality and advertising receptivity for reaching wealthy audiences.
Marketing Charts analysis highlighted that wealthy households maintain primetime viewing despite adopting streaming heavily. The key finding: affluent viewers time-shift extensively, watching when convenient rather than live. This has implications for live sports and event programming, which remains appointment viewing even for time-pressed affluent audiences.
Pew Research Center's ongoing surveys show streaming adoption remains strong across income levels. The July 2025 survey found that while higher-income adults are most likely to stream, substantial majorities across all income groups use streaming services. The income gap lies more in platform selection and time spent than in basic adoption.
Multiple factors contribute to this pattern. Lower-income households may have fewer alternative entertainment options that require spending, making TV's value proposition particularly attractive. More available leisure time, whether due to work patterns, unemployment, or caregiving responsibilities, also plays a role. Additionally, lower-income households tend to concentrate media usage on fewer devices, spending more time with each device they own.
Not as much as commonly assumed. Research from Ipsos shows that affluent viewers, particularly engaged OTT Affluencers, are actually advertising-receptive when advertising reaches them in appropriate contexts. They spend significantly more on streaming subscriptions but still engage with ad-supported content, particularly during live sports, news programming, and premium original series. Premium content environments tend to generate higher attention and recall among affluent viewers who do encounter advertising. The key is reaching affluent audiences in contexts they value rather than assuming they categorically reject advertising on principle.
Higher-income households over-index on premium services like Netflix, HBO Max, and ad-free tiers of major platforms. They maintain more total subscriptions, often four or more simultaneously, and spend significantly more annually on video services. The willingness to pay premium prices for convenience, original content, and ad-free experiences distinguishes their platform selection. Lower and middle-income households show higher adoption of free ad-supported streaming (FAST) platforms like Pluto TV and Tubi, as well as ad-supported tiers of subscription services that offer lower prices in exchange for advertising. This creates a bifurcated streaming market where advertisers can reach different income segments based on platform selection.
Connected TV platforms generally offer demographic targeting including household income proxies derived from data partnerships. Advertisers can specify income ranges for campaigns, ensuring ads reach households matching their target customer profile. Platform selection also helps: premium original content indexes higher with affluent viewers, while FAST channels reach value-focused audiences efficiently.
No. While cord-cutting has accelerated dramatically overall, cable retention remains surprisingly strong among higher-income households, often because of bundled services that include internet, sports content unavailable elsewhere, or the time-shifting capabilities that DVR provides. Wealthy households maintain their share of primetime cable viewing while also streaming heavily across multiple platforms. They simply have more options and use multiple platforms simultaneously rather than choosing one over another. The assumption that cable viewers are exclusively downscale leads some premium advertisers to undervalue cable inventory that actually reaches affluent households effectively.
Platforms like Adwave make TV advertising accessible starting at $50, with demographic targeting that includes income-based options. Small businesses can specify the household income range most aligned with their customer base and run campaigns reaching that specific segment. Geographic targeting layered with income data allows local businesses to reach affluent or value-focused viewers in their specific service areas. A luxury home services company can target high-income ZIP codes, while a value-focused retailer can reach budget-conscious households in their trading area. This precision was impossible with traditional TV buying but is standard with streaming TV platforms.
Key statistics on TV viewing by income level:
Heavy viewing gap: Under $75K households are 33% more likely to be heavy TV viewers; $150K+ households are 43% less likely (Industry Analysis, 2025)
Streaming spending: Affluent households ($125K+) spend $509/year on video vs $418 for general population (Ipsos)
Willingness to pay: Affluent households willing to spend $591/year on video, vs $444 for general population (Ipsos)
Device usage: Lower-income households use devices they own more intensively than higher-income households (Nielsen)
Streaming adoption: 75%+ of middle and lower-income adults use streaming services (Pew Research, July 2025)
OTT Affluencer engagement: 88% of category-influential affluent viewers use paid streaming (Ipsos)
Ad receptivity: Affluent "OTT Affluencers" index 558 on giving viewing advice, demonstrating category influence (Ipsos)
Time-shifting: Affluent households DVR and time-shift TV more than other income segments (Marketing Charts)
Content preference: Affluent viewers over-index on political dramas, live sports, movies, and children's programming (Ipsos)
Multicultural patterns: Income level equalizes viewing patterns across racial/ethnic groups (Nielsen)
All sources linked above. Data current as of Q4 2025.
Ready to reach your target income segment on television? Whether you're targeting affluent households or value-conscious consumers, streaming TV advertising makes precision targeting accessible. Adwave lets you create professional commercials and launch demographically targeted campaigns across 100+ premium channels, starting at just $50.