-
47.6%
Streaming's share of U.S. TV viewing (April 2026)
-
21.6%
Cable's share of U.S. TV viewing (April 2026)
-
$30/day
Starting daily budget for multichannel media on Adwave, including TV
Update, September 23, 2026: Nielsen has published May, June, and July 2026 Gauge reports since this page was first written. April remains the record on this URL. Later category shares, including July streaming at 49.0% and cable at 18.7%, are on the Q3 2026 cable vs streaming page. Read the April figures below as April.
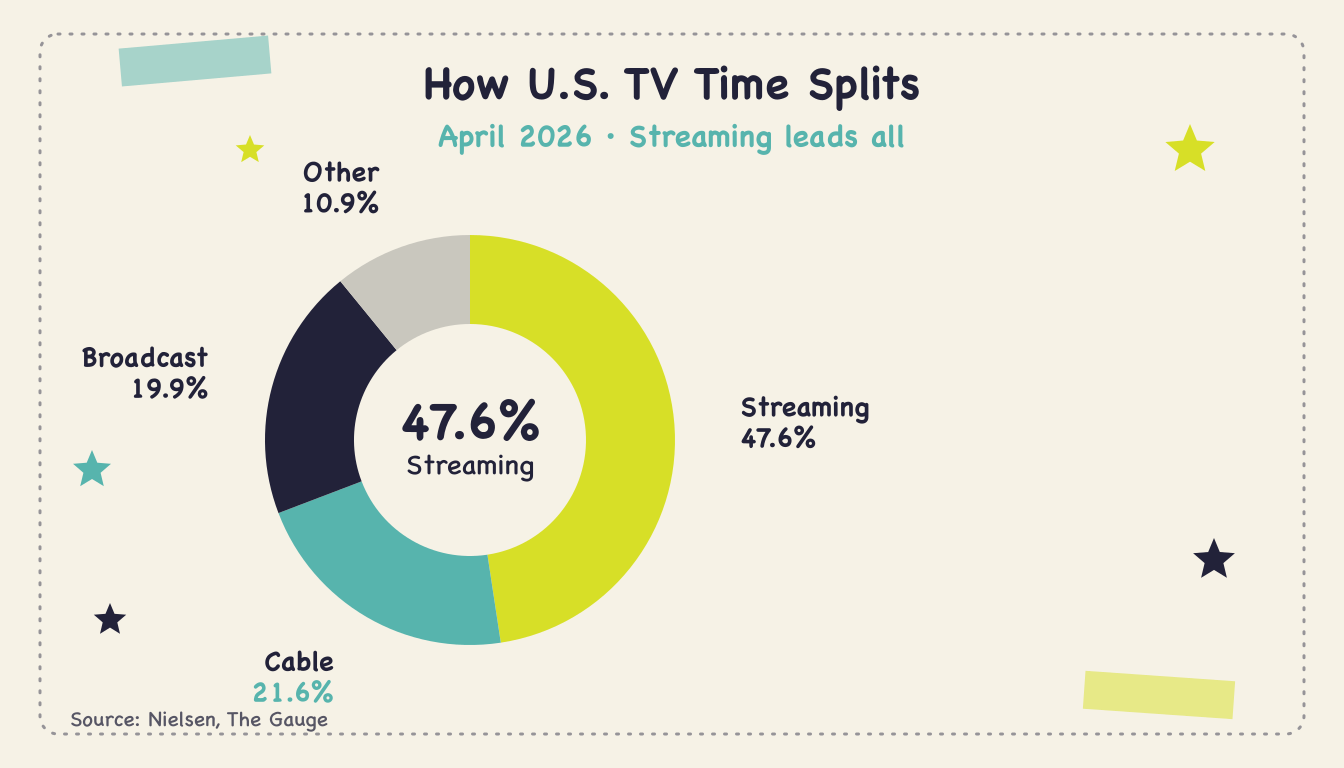
In April 2026, streaming took 47.6% of all U.S. TV viewing while cable held just 21.6%, according to Nielsen's The Gauge. That's a gap of about 26 percentage points between the two. Rewind less than four years and they were tied. Streaming passed cable and kept pulling ahead, and in that April month it was ahead of cable and broadcast combined.
For a small business deciding where to advertise, this is the single most important shift in television. The audience didn't leave TV, it moved to a different kind of TV, one that was built for advertisers of every size instead of national brands with cable-sized budgets. Let's break down exactly how the cable-versus-streaming split looks in Q2 2026, how fast the lines crossed, and what it means for reaching customers on the screen where they now watch.
What the data shows
Every month, Nielsen's The Gauge measures how Americans split their television time across broadcast, cable, streaming, and other uses. The April 2026 report, released June 25, 2026, is the freshest complete picture, and it tells a clear story.
Here's how U.S. TV viewing split in April 2026:
Streaming: 47.6% (nearly half of all TV time)
Cable: 21.6%
Broadcast: 19.9%
Other (gaming, physical media, unmeasured tuning): 10.9%
Streaming's 47.6% is more than cable and broadcast combined, which together came to 41.5%. Put another way, the two pillars of traditional television, the cable bundle and over-the-air networks, no longer add up to what people watch on streaming. That crossover, streaming beating all of traditional TV at once, first happened in May 2025, and streaming has held the lead since.
One nuance worth stating, because it keeps the picture honest: cable isn't collapsing in a straight line month to month. Cable ticked up to 21.6% in April, a six-month high, on the strength of live sports like the NCAA championship, the NBA playoffs, and the Masters. Live sports remain cable's strongest hand. But the multi-year direction is unmistakable, and the annual comparison shows it plainly. If you want the fuller view of how streaming's share of TV viewing climbed to this point, our overview traces the whole arc.
A quick note on timing: April is the last month Nielsen has fully reported as of late July 2026. Nielsen delayed its March Gauge amid a dispute over new measurement methodology, and the recalibrated version isn't expected until the fall. So every figure here reflects data through April 2026, not a May or June estimate.
How Nielsen measures the split, and why April is the latest number
The cable-versus-streaming numbers come from the same national panel Nielsen uses for its TV ratings, measuring actual viewing on television sets across a representative sample of U.S. households. The Gauge then divides that total into broadcast, cable, streaming, and other, so the percentages always add to 100 and each category is measured the same way month to month. That consistency is what makes the year-over-year comparison trustworthy: a 2.9-point cable decline isn't a change in method, it's a change in behavior.
This year the reporting cadence slipped. Nielsen delayed its March 2026 Gauge amid a dispute over a new measurement approach it had begun rolling out, and it has signaled the recalibrated version won't fully arrive until the start of the fall season. For anyone reading these figures, the practical takeaways are simple:
April 2026 is the last fully reported month. Treat the 47.6%-to-21.6% split as the current confirmed picture, not a stand-in for May or June.
Categories are measured consistently. Even through the recalibration debate, the way streaming, cable, and broadcast are split hasn't changed, so the trend line holds.
One month is noise, the trend is signal. Cable's April uptick is exactly why you weigh the annual move over any single report.
None of this softens the headline. Across every month Nielsen has reported in 2026, streaming leads cable by more than 25 points, and the yearly comparison shows the gap widening, not closing.
Breaking down the numbers
The year-over-year move is where the cable-versus-streaming story gets stark. Comparing the same month a year apart strips out seasonal noise and shows the underlying trend.
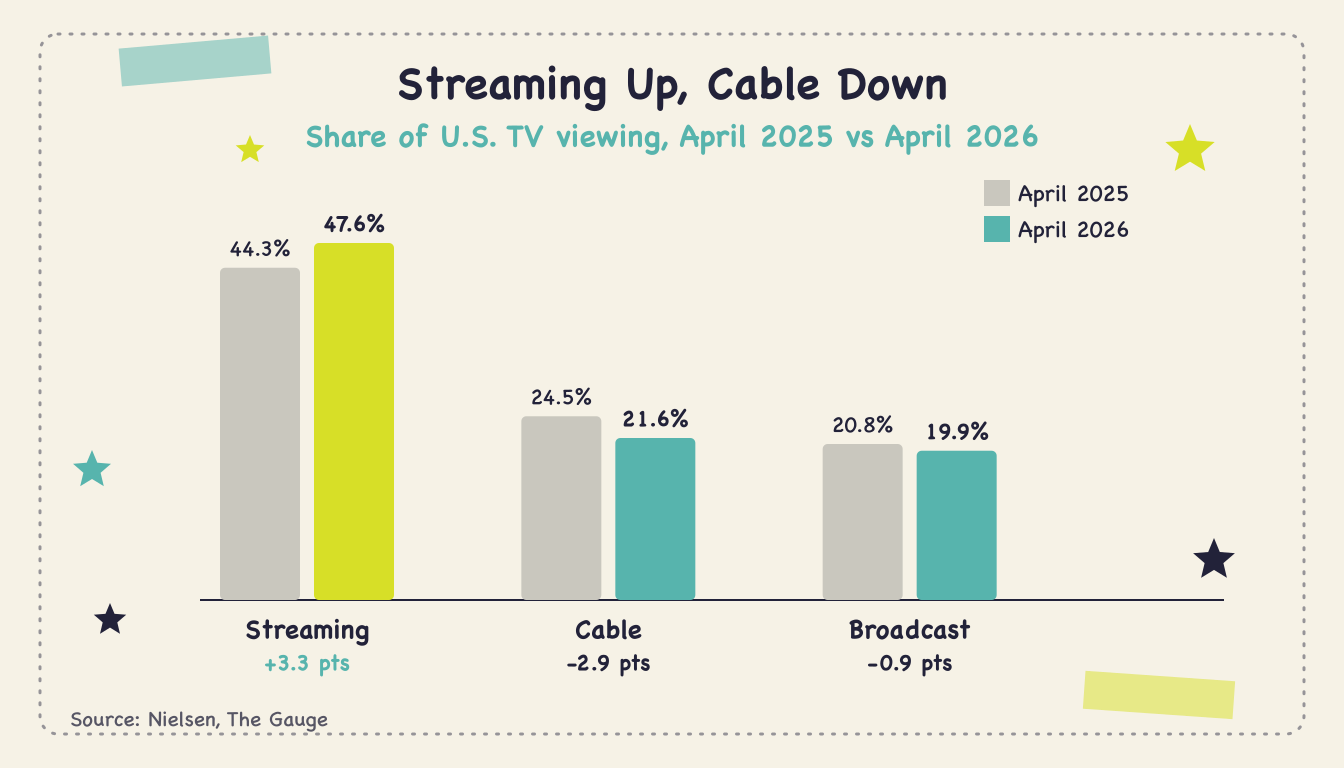
From April 2025 to April 2026, here's how the three categories shifted:
Streaming: 44.3% to 47.6%, a gain of 3.3 points
Cable: 24.5% to 21.6%, a loss of 2.9 points
Broadcast: 20.8% to 19.9%, a loss of 0.9 points
In a single year, streaming added more than three points while cable shed nearly three. That's not a blip, it's a steady transfer of attention from the bundle to the app. Cable has now given up roughly a fifth of its viewing share in twelve months, and the trend has been running the same direction for years.
To make the pace concrete: in mid-2022, cable and streaming each held about a third of TV viewing. By April 2026, streaming had climbed to nearly half while cable slid to just over a fifth. Cable didn't lose to one competitor, it lost to a category, as viewers spread across dozens of streaming apps that collectively swallowed the attention cable once owned. And because each year's decline compounds on the last, the losses aren't slowing, they're accumulating.
Step back to see how fast this happened. Streaming first passed cable in July 2022, when it hit 34.8% against cable's 34.4%, a lead of four-tenths of a point. Less than four years later that gap is about 26 points. The two lines didn't just cross, they diverged sharply, and nothing in the monthly data suggests the direction is reversing. Our cable vs streaming viewers breakdown puts the head-to-head audience numbers side by side.
What sits underneath the viewing shift is a subscription shift. People aren't just watching less cable, they're canceling it, and that cord-cutting is what turns a viewing trend into a permanent one.
Why it matters for your business
A percentage on a chart can feel abstract. Here's the concrete version: your customers spend nearly half their TV time on streaming and barely a fifth on cable, and the trend is moving further that way every quarter. If your advertising instincts are still shaped by the old cable world, they're pointed at a shrinking audience.
Three practical consequences follow for a local business:
The audience concentrated where you can buy. Cable advertising meant local sales reps, rate cards, and minimums. Streaming, specifically connected TV advertising, is self-serve and open to any budget, which is why the shrinking side of the split is the expensive side and the growing side is the affordable one.
Targeting got sharper as viewing moved. Cable sells you a broad daypart. Streaming lets you target by geography, household, and interest, so a local business only pays to reach its actual service area instead of a whole media market.
The measurement caught up. Streaming campaigns tie back to website visits, branded search, and foot traffic in ways a cable spot never could, which matters most when every dollar has to prove itself.
There's a trust angle too. A 30-second spot on the big living-room screen carries a credibility that a social feed doesn't, and streaming delivers that same premium-screen effect at a fraction of cable's cost. CTV and linear TV differ in how the ad is delivered and in who can buy a local flight. Streaming buys can be sized to a service area. Cable flights often start from a larger minimum.
How to take advantage
Knowing streaming won the TV day is useful. Acting on it is what brings in customers. You don't need to overthink the cable-versus-streaming decision, the viewing data already made it. Here's how a small business puts ad dollars where the audience is.
Follow the viewing, not the habit. If you've run cable spots before, redirect that budget to connected TV, where nearly half of TV time now lives and where the same audience is reachable for less.
Target your service area. Set a geographic radius, usually 15 to 25 miles, so every impression lands on a potential customer instead of a distant viewer.
Budget for frequency. Plan enough spend to reach the same households several times over two to three weeks. On streaming, meaningful frequency costs hundreds of dollars, not the thousands cable minimums demanded.
Approve the ads, then measure the site. You approve what runs before you spend. A first-party site tracker ties later visits back to the campaign, which is how TV shows up when the spot itself has no click.
Measure what moves. Track branded search, direct traffic, and calls during and after a flight rather than chasing clicks, since TV ads build demand you capture elsewhere.
Adwave runs paid media on Meta, Google, TikTok, Reddit, web, and TV from one prepaid daily budget starting at $30/day, with local radius or ZIP targeting and a first-party site tracker. Individual signups typically get a $60 starter credit. You approve ads before you spend. For the cost side of television, the average CTV CPM page shows the planning bands.
The bigger picture
The cable-versus-streaming split isn't just a viewing story, it's a money story, and the ad dollars are following the eyeballs with a short lag. Understanding where spending is headed tells you where the smart positioning is.
A few forces give the April 2026 numbers their weight:
Cord-cutting made the shift structural. Traditional pay-TV now reaches under 48 million U.S. households per Leichtman Research Group, down steadily year after year, while streaming-only homes keep growing. When viewers cancel cable, they don't drift back, which is what separates this from a passing trend. Our cord-cutting statistics page tracks the household decline in detail.
Ad budgets are crossing over too. Connected TV ad spending is projected to reach roughly $38 billion in 2026, up about 14% year over year, while traditional TV ad spend slips to around $27.9 billion, per eMarketer. In the 2026 upfronts, CTV outsold primetime linear for the first time. The advertisers are moving because the audience already did.
The gap is near its widest right now. Streaming's lead tends to peak in summer and compress a bit in the fall when the NFL and new broadcast seasons lift cable and broadcast. So the Q2 window captures the split near its extreme, which makes it a useful moment to reset where your budget points.
For small businesses, the throughline is that the affordable screen and the popular screen are now the same screen. For decades, TV's most-watched inventory was also its most expensive and most gated. Streaming broke that link. The connected TV advertising market is expanding precisely because it opened premium TV to advertisers cable never served.
What experts are saying
Nielsen has been careful to frame streaming's dominance as real but not static. When streaming first beat cable and broadcast combined in May 2025, the company noted the milestone while cautioning that the lead "is almost certainly not permanent" on a month-to-month basis, since live sports and new fall lineups can pull viewing back to linear for stretches. April 2026's cable uptick to a six-month high proved that point in real time.
Analysts covering the ad market see the same trajectory from the money side. eMarketer has described connected TV as television's growth engine while linear declines, pointing to the 2026 upfronts, where CTV spending passed primetime linear for the first time, as the moment the industry's checkbook caught up with its audience. The consensus isn't that cable disappears overnight, live sports and news will keep it relevant for years, but that the center of gravity in both viewing and ad spending has already moved to streaming, and it's not moving back. For advertisers, especially small ones, the takeaway is consistent across the trade press: the growth, the targeting, and the accessible pricing are all on the streaming side of the split.
Where cable still holds on
Streaming's dominance is real, but a smart advertiser knows where the exceptions live. Cable hasn't vanished, and understanding its remaining strongholds keeps your plan grounded.
Live sports. This is cable's anchor. Playoff basketball, the Masters, and marquee matchups still pull big linear audiences, which is why cable ticked up to a six-month high in April. If your customers are heavy sports viewers, linear keeps some pull, though streaming now carries a growing slate of live sports too.
Breaking news and local events. Cable news and local broadcast still command attention during major news moments, and older demographics lean on them more heavily.
Habit among older households. Cord-cutting is fastest among younger viewers. Households that have kept cable for decades change slowly, so if your target skews older, some of them are still on the bundle.
Here's the balanced read: cable is a declining but not dead channel, strongest in live sports and news, weakest everywhere else. For most local businesses, that means streaming should carry the bulk of a TV budget, with cable considered only if your specific audience clusters around live sports or news. The viewing split, 47.6% streaming to 21.6% cable, tells you where the weight belongs, and it's not a close call for the average small business.
What the numbers don't tell you
The 47.6%-versus-21.6% headline is powerful, but read it with a few caveats so you plan around reality rather than the raw number.
Cable still owns live sports. The one place linear reliably wins is live events, which is why cable spikes during playoff months. If your customers are die-hard sports viewers, cable isn't irrelevant, though streaming now carries plenty of live sports too.
Share isn't your customer. Streaming's near-half share spans everyone. Your buyers are a slice defined by location, age, and interest, and the value of connected TV is reaching that slice precisely, not buying raw reach.
Monthly numbers oscillate. April's cable bump shows a single month can wobble with the sports calendar. Build your plan around the multi-year trend, not one leaderboard.
"Other" is real viewing too. The 10.9% in the "other" bucket is gaming and unmeasured tuning, a reminder that the TV screen does more than stream and broadcast. It doesn't change the cable-versus-streaming verdict, but it's part of the full picture.
Read the split as direction, not destiny for any single month: viewing and ad money have both moved decisively to streaming, and that's what should shape your budget.
Common questions answered
Is streaming really bigger than cable now? Yes, and by a wide margin. In April 2026, streaming held 47.6% of U.S. TV viewing to cable's 21.6%, a gap of about 26 points. Streaming also beats cable and broadcast combined, which together reached 41.5%. This reflects viewing on television sets as measured by Nielsen's The Gauge, the industry's standard scoreboard.
When did streaming pass cable? Streaming first overtook cable in July 2022, when it reached 34.8% against cable's 34.4%. The two were nearly tied then. In under four years the gap widened to roughly 26 points, and streaming passed cable and broadcast combined in May 2025. The trend has been consistent and one-directional.
Why did cable go up in April 2026? Live sports. The NCAA championship, NBA playoffs, and the Masters pulled viewing to cable, lifting it to a six-month high of 21.6%. It's a reminder that cable still wins big live events. The longer-term trend, though, is a steady decline, with cable down 2.9 points year over year.
Does this mean I should stop advertising on cable? For most small businesses, streaming is now the better use of a limited budget, since it reaches nearly half of TV viewing at lower cost and with sharper targeting. Cable can still make sense for advertisers focused on live sports audiences. But if you're choosing where new dollars go, the viewing data points clearly to connected TV.
How much does streaming TV advertising cost? The average CTV CPM page uses a rough $15 to $35 planning band. Adwave media starts at $30/day prepaid, TV included with search and social, and individual signups typically get a $60 starter credit. That is a different purchase from a cable flight with a large minimum.
The numbers at a glance
Key figures behind the Q2 2026 cable-versus-streaming split, with sources:
47.6%: Streaming's share of U.S. TV viewing, April 2026 (Nielsen, The Gauge)
21.6%: Cable's share of U.S. TV viewing, April 2026, a six-month high (Nielsen, The Gauge)
19.9%: Broadcast's share of U.S. TV viewing, April 2026 (Nielsen, The Gauge)
41.5%: Cable plus broadcast combined, still below streaming (Nielsen, The Gauge)
+3.3 / −2.9: Year-over-year point change for streaming and cable, April 2025 to April 2026 (Nielsen)
July 2022: When streaming first passed cable, 34.8% to 34.4% (Nielsen)
May 2025: When streaming first beat cable and broadcast combined (Nielsen)
~48 million: U.S. households still on traditional pay-TV (Leichtman Research Group)
~$38 billion: Projected 2026 U.S. connected TV ad spend, up ~14% YoY (eMarketer)
Advertise where the audience watches, from $30/day
The cable-versus-streaming question is settled for anyone reading the data: streaming took 47.6% of U.S. TV viewing in April 2026, cable held 21.6%, and the gap keeps widening. The good news for small businesses is that the winning screen is also the affordable one.
Adwave runs TV with search and social from $30/day, with a first-party site tracker. See pricing for the current floor. The April split is above. Later months are on the Q3 page.