Ready in minutes
AI builds your ad from a single prompt

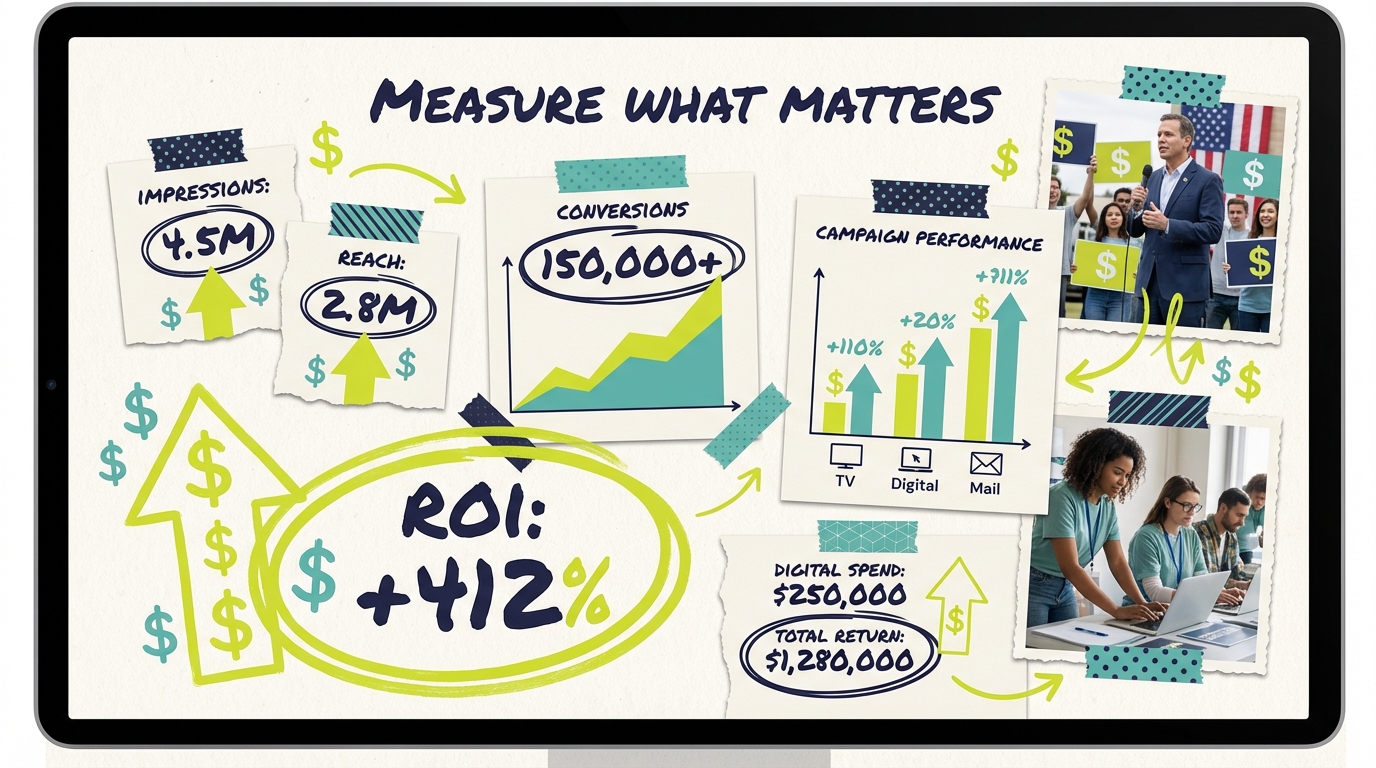
April 11, 2026
Political media buyers face a measurement problem that gets worse every election cycle. Budgets are bigger, channels are more fragmented, and the pressure to prove that every dollar drove results has never been higher. AdImpact projects $10.8 billion in total political ad spending for the 2026 midterms, with $2.5 billion flowing to CTV and streaming alone.
The campaigns that win aren't just the ones that spend the most. They're the ones that measure the most effectively and reallocate budget toward what's working before election day arrives.
This guide covers the specific metrics, tools, and methodologies you need to measure political media buy performance across TV, CTV, and digital channels. Whether you're managing a congressional race or a statewide campaign, these frameworks will help you prove impact and optimize spend in real time.

Political media buyers have traditionally lived in two separate worlds. Broadcast and cable buyers think in GRPs (Gross Rating Points). Digital and CTV buyers think in impressions, CPMs, and completion rates. Understanding both systems, and where they overlap, is essential for measuring cross-channel political campaigns.
A GRP measures the percentage of your target audience reached, multiplied by the frequency of exposure. If your ad reaches 20% of your target audience and runs 5 times, that's 100 GRPs.
For decades, GRPs have been the currency of broadcast and cable TV buying. Political media buyers set GRP targets based on the size of the race, the competitiveness of the market, and the stage of the campaign. Here's how those targets typically break down:
Awareness phase: 200-400 GRPs per week to build name recognition
Persuasion phase: 400-600 GRPs per week to move opinion
GOTV (Get Out The Vote): 600-1,000+ GRPs per week for maximum saturation
The strength of GRPs is that they provide a consistent benchmark for broadcast buying. A media buyer can compare 300 GRPs in one market to 300 GRPs in another and understand relative investment levels.
The weakness? GRPs don't tell you much about who actually saw your ad, whether they watched the whole thing, or what they did afterward. They measure opportunity to see, not actual engagement. And in a world where voter attention is split across broadcast, cable, and streaming, broadcast GRPs capture a shrinking share of the picture.
CTV and digital advertising operate on a fundamentally different measurement model. Instead of estimating audience delivery through panel-based ratings, digital platforms measure actual ad delivery at the device or household level.
Impressions. The total number of times your ad was served. Unlike GRPs, impressions represent confirmed ad deliveries, not estimates.
Unique household reach. How many distinct households saw your ad. This is the digital equivalent of "reach" in the GRP formula, but measured directly rather than estimated from panel data.
Frequency. The average number of times each reached household saw your ad. For political CTV campaigns, the optimal frequency range is 8-12 impressions per household over a campaign cycle. Below 5, the message doesn't stick. Above 15, you're hitting diminishing returns and wasting budget.
Video Completion Rate (VCR). The percentage of viewers who watched your entire ad. CTV typically delivers 90-97% completion rates because ads are non-skippable. If your VCR drops below 85%, something is wrong with the creative or placement.
Cost Per Completed View (CPCV). Total spend divided by the number of completed views. This gives you a cleaner picture of cost efficiency than CPM alone because it accounts for whether voters actually watched the ad.
CPM (Cost Per Thousand Impressions). The standard pricing metric for CTV. Political CTV CPMs typically range from $20-$45, depending on targeting specificity and market competitiveness. Battleground state CPMs can run 30-50% higher than non-competitive markets during peak election windows.
The real measurement challenge in 2026 campaigns is reconciling GRP-based broadcast buys with impression-based CTV buys. Here's how to translate between the two systems:
GRP to impression conversion: In a market with 500,000 TV households, 100 GRPs equals 500,000 impressions (100% of the audience reached once). This conversion lets you compare broadcast and CTV investment on a common scale.
TRP (Target Rating Points) for precision. TRPs refine GRPs by focusing on your specific target demo rather than the entire market. If your campaign targets voters 35-64 and they represent 45% of a market, 100 GRPs among adults 18+ might equal 220 TRPs among your target. CTV targeting makes TRPs more actionable because you can actually restrict delivery to your target audience.
iGRP (Impression-Based GRP). Some measurement platforms now calculate iGRPs, converting digital impressions into GRP equivalents for cross-platform comparison. This allows media buyers to plan and evaluate unified campaigns using a common currency.
Political campaigns rarely run a single channel. A typical 2026 midterm media plan includes broadcast TV, cable, CTV, digital video, social media, radio, and sometimes direct mail. Measuring the combined impact of these channels is where most campaigns fall short.
Here's the core problem: a voter sees your broadcast TV ad during the local news, catches your CTV ad on Hulu the next evening, sees your Facebook ad on their commute, and then visits your campaign website. Which channel gets credit for driving that website visit?
The honest answer is all of them, in varying degrees. But most campaign reporting treats each channel as independent, which creates blind spots and misallocated budgets.
The most effective political media operations in 2026 use a layered approach to cross-channel measurement:
Layer 1: Channel-level delivery metrics. Track each channel's core delivery metrics independently. Broadcast GRPs, CTV impressions and reach, digital clicks and views, social engagement. This is your baseline, and every campaign should have this regardless of budget.
Layer 2: Correlation analysis. Map your media activity against observable outcomes. When your TV flights are running, do website visits increase? Do branded searches spike? Do donation page visits go up? Correlation isn't causation, but consistent patterns across multiple campaigns build confidence.
Layer 3: Incremental lift testing. The gold standard. Run your CTV campaign in select markets or to select audience segments, and hold out a control group. Compare outcomes (search lift, website visits, polling movement) between exposed and unexposed groups. This isolates TV's specific contribution.
Layer 4: Multi-touch attribution (MTA). For larger campaigns with the data infrastructure, MTA models assign fractional credit to each touchpoint in a voter's journey. This requires tracking voter-level exposure across channels, which CTV's device-level measurement makes possible in ways broadcast never could.
Match your measurement to your budget. A state legislative campaign spending $30,000 total shouldn't invest in a full MTA platform. Correlation analysis (Layer 2) provides 80% of the insight at 10% of the cost. Reserve Layers 3 and 4 for congressional and statewide races.
Use CTV as your measurement anchor. CTV provides household-level delivery data, making it the most precise measurement point in your media mix. If you know exactly which 50,000 households received your CTV ad, you can compare their search and website behavior against similar households that didn't.
Establish shared KPIs across channels. Agree on a common set of outcome metrics (branded search lift, website visits from target geography, donation page conversions) that every channel gets measured against.

One of the hardest parts of political media measurement is knowing what "good" looks like. Commercial advertising has years of established benchmarks. Political advertising benchmarks are harder to find because campaigns guard their data closely and every race is different.
Here are the benchmarks political media buyers should track in 2026, based on aggregated industry data from the IAB, Video Advertising Bureau, and Kantar political tracking.
Total campaign reach target. A well-executed cross-channel political media buy should reach 60-80% of registered voters in the target geography at least 3 times across all channels combined. Reaching 80%+ at 5+ frequency represents elite-level saturation.
Channel overlap. Expect 20-35% audience overlap between broadcast and CTV. This isn't waste. Research from the Video Advertising Bureau shows that voters exposed on both broadcast and CTV show 22% higher recall and 18% higher favorability lift than those exposed on one channel alone.
Cost per reached voter. Across all channels combined, competitive congressional campaigns average $3-8 per reached voter (all impressions included). State legislative races can achieve $1-4 per reached voter because of lower market competition. These benchmarks help you evaluate whether your combined media buy is efficient.
Budget and performance expectations vary dramatically by race type. Here's what the data shows for CTV campaigns specifically:
Knowing what to measure is only half the equation. You also need the right tools and processes to collect, analyze, and act on the data. Here's what's available in 2026.
Platform-native analytics. Every CTV advertising platform provides delivery metrics: impressions, reach, frequency, completion rates, and CPM. Platforms like Adwave offer real-time dashboards that show campaign delivery as it happens. This is your first line of measurement, and it's included in your media spend.
Brand lift studies. Several CTV platforms partner with survey providers to measure ad recall, message association, and favorability among exposed vs. unexposed audiences. These typically cost $5,000-20,000 per study, making them accessible for congressional races and above. They provide the most direct measurement of whether your ad is moving voter perception.
Incrementality testing. Hold out a random subset of your target audience from CTV delivery, then compare outcomes between the exposed group and the holdout. This isolates CTV's causal impact from organic trends. Most programmatic CTV platforms support holdout testing as a standard feature.
Nielsen ratings. Still the standard for broadcast TV measurement. Nielsen provides post-buy analysis showing actual delivery against your target GRPs. The shift to Nielsen ONE, which combines panel and big data measurement, is improving accuracy for 2026.
Kantar/CMAG ad tracking. Kantar's Campaign Media Analysis Group tracks every political ad airing on broadcast and cable TV. This data lets you monitor your own delivery and, critically, your opponent's spending and creative. Kantar subscriptions typically start at $10,000-25,000 per cycle for political clients.
Comscore. Provides set-top box data that measures actual tune-in rather than panel-based estimates. Increasingly used for local market political measurement where Nielsen panels are too small to be reliable.
Google Trends and Search Console. Free tools that every political campaign should monitor. Track branded search volume for the candidate's name in target markets. Compare search trends in markets where you're running TV vs. markets where you're not. A consistent search lift during TV flights is strong evidence of impact.
Website analytics (Google Analytics, campaign CRM). Track website visits, donation page views, volunteer sign-ups, and email sign-ups by geography and time period. Overlay your media flight schedule to identify correlations between TV activity and website behavior.
Voter file matching. Advanced methodology that matches CTV-exposed households against voter files to measure downstream behavior. Did households that received your CTV ads register at higher rates? Did they vote at higher rates? Did they request mail ballots? This is the closest you can get to actual vote-level attribution. Services like L2 Political and TargetSmart offer voter file matching for CTV campaigns, typically at $0.02-0.05 per matched record.
Polling remains the most direct way to measure ad impact on voter attitudes. Track name recognition, favorability, vote intent, and message recall through tracking polls fielded weekly or bi-weekly in target markets. Map changes against your media flight schedule.
For more rigorous analysis, survey voters in your CTV target area alongside voters in a comparable area where you're not running CTV. Professional tracking polls run $5,000-15,000 per wave for local and state races. Online panel surveys offer a lower-cost alternative at $1,000-3,000 per wave.

A measurement plan should be in place before you spend a single dollar on media. Here's the framework political media buyers should follow.
Start by identifying 3-5 key metrics that define success for your specific campaign. Not every metric matters equally for every race.
For a name recognition campaign (challenger in early stages): prioritize branded search lift, unaided name recognition in polls, and household reach percentage.
For a persuasion campaign (competitive race, both candidates known): prioritize favorability movement, vote intent shift, and message recall.
For a GOTV campaign (final weeks): prioritize target voter reach and frequency, early vote correlations, and website/landing page traffic to your "find your polling place" page.
Measure everything you plan to track before your first ad airs. This seems obvious, but roughly 40% of political campaigns skip baseline measurement according to the AAPC (American Association of Political Consultants).
At minimum, capture:
Current branded search volume (Google Trends)
Website traffic levels by geography
Baseline polling (name recognition, favorability, vote intent)
Current social media mention volume
For CTV: Confirm your platform dashboard is accessible and reporting correctly. Set up automated weekly reports and configure holdout groups for incrementality tests.
For broadcast: Confirm post-buy analysis delivery with your stations. Request weekly delivery reports, not just end-of-flight summaries.
For digital/social: Configure UTM tracking on all campaign links and set up Google Analytics segments for target geographies.
Report on channel-level delivery metrics weekly, outcome metrics (search trends, website traffic, donations) bi-weekly, and polling or brand lift results monthly. After the campaign, run a full attribution analysis with cost-per-outcome calculations.
More importantly, define decision triggers in advance. If CTV frequency exceeds 15 per household, expand targeting rather than saturating the same voters. If branded search lift plateaus, rotate creative. If one channel significantly outperforms, shift 10-20% of underperforming channel budget toward the winner. And if polling shows no movement after 4 weeks of TV, evaluate the creative messaging before cutting budget.
CTV has changed the measurement game for political campaigns in ways that traditional TV never could. Here's why CTV should be the backbone of your political media buying measurement strategy.
Deterministic delivery data. Unlike broadcast ratings based on panel samples, CTV measures actual ad delivery at the household level. You know exactly how many households saw your ad, how many times, and whether they watched the whole thing.
Real-time optimization. Broadcast buys are locked in days or weeks before they air. CTV campaigns can be adjusted in real time. If one audience segment is responding strongly, shift more budget there tomorrow.
Audience-level matching. CTV delivery data can be matched against voter files, consumer databases, and website visitor logs, creating a measurement chain from ad delivery to voter behavior that broadcast can't replicate.
Lower testing thresholds. On broadcast, testing creative variants requires buying separate flights. On CTV, you can A/B test creatives against identical audience segments simultaneously and have statistically significant results within days.
For campaigns at every level, from city council to statewide, platforms like Adwave make it possible to run measurable CTV campaigns starting at $50. You don't need a six-figure budget to get household-level delivery data and real-time performance analytics.
What's the difference between GRPs and impressions for political ads? GRPs (Gross Rating Points) estimate what percentage of your target audience saw your ad on broadcast or cable TV, based on panel data. Impressions count the actual number of times a digital or CTV ad was served. One hundred GRPs in a market of 500,000 TV households equals roughly 500,000 impressions. The key difference is precision: GRPs are estimates, while CTV impressions represent confirmed deliveries. For 2026 campaigns running both broadcast and CTV, you'll need to track both and convert between them for unified reporting.
How much should a political campaign spend on measurement vs. media? Industry best practice is to allocate 5-10% of your total media budget to measurement and analytics. For a $100,000 CTV campaign, that's $5,000-10,000 for polling, brand lift studies, and analytics tools. Smaller campaigns can rely more heavily on free tools like Google Trends and website analytics, which provide useful signal at no additional cost. The one investment every campaign should make regardless of budget is baseline polling before ads launch.
Can you measure political ad ROI without expensive polling? Yes. While polling provides the most direct measurement of voter attitudes, several free or low-cost methods deliver meaningful insight. Google Trends tracks branded search volume, website analytics show traffic patterns from target geographies, and CTV platform dashboards provide delivery and completion data in real time. A state legislative campaign spending $25,000 on CTV can build a solid measurement framework using these tools alone.
How do you measure the combined impact of broadcast TV and CTV for political campaigns? Start by converting both channels to a common metric. Use iGRPs (impression-based GRPs) to translate CTV impressions into GRP equivalents, or convert broadcast GRPs into estimated impressions. Track shared outcome metrics like branded search lift and website traffic across all TV investments. For more advanced measurement, use voter file matching to identify households reached by CTV and cross-reference with broadcast coverage areas to estimate overlap and incremental reach.
What's a realistic timeline for seeing results from political CTV advertising? Initial delivery metrics (impressions, reach, completion rates) are available in real time. Branded search lift typically becomes measurable within 1-2 weeks of launching a CTV campaign. Website traffic patterns often show correlations within the first week. Polling-based measurements (name recognition, favorability) require 3-4 weeks to show statistically significant movement. Plan for at least a 4-week flight to generate meaningful cross-channel performance data.
How does Adwave help political campaigns measure media buy performance? Adwave provides real-time analytics dashboards that track every impression, completion, and reach metric from the moment your campaign launches. Political campaigns can see exactly how many households in their target geography received their ad, at what frequency, and with what completion rate. Starting at just $50, campaigns at any level can access the same measurement infrastructure that was previously limited to well-funded statewide races. Combined with free tools like Google Trends, this gives even local candidates a clear picture of whether their media buy is working.