-
13.4%
YouTube's share of U.S. TV viewing, the most-watched streaming service (April 2026)
-
47.6%
Total streaming share of U.S. TV viewing (April 2026)
-
$30/day
Starting daily budget for multichannel media on Adwave, including TV
Update, September 26, 2026: This page records April 2026. Nielsen's July 2026 Gauge, released September 10, 2026, puts YouTube at 14.2% of TV and total streaming at 49.0%. That release does not republish the full service table below. Treat every rank on this page as April.
The most-watched streaming service in the April 2026 Gauge is YouTube, at 13.4% of all TV viewing. In that month Nielsen ranked it ahead of any single cable network or broadcaster in the write-up this page follows. Netflix ranks second among the streaming services named there at 7.8%.
Here's the twist that matters for a small business: the service with the most viewers isn't the one with the most subscribers. YouTube wins on watch time while charging nothing, Netflix wins on paid subscriptions, and the entire top of the ranking is now ad-supported. The most-watched screens in the country turned into advertising inventory that any budget can reach. Let's break down the full Q2 2026 ranking, the viewers-versus-subscribers distinction, and what it means for where you put your ad dollars.
What the data shows
Nielsen's The Gauge measures how Americans split their television time, and within streaming it names the individual services. The April 2026 report, released June 25, 2026, is the latest complete picture, and it gives a clear ranking of who's being watched.
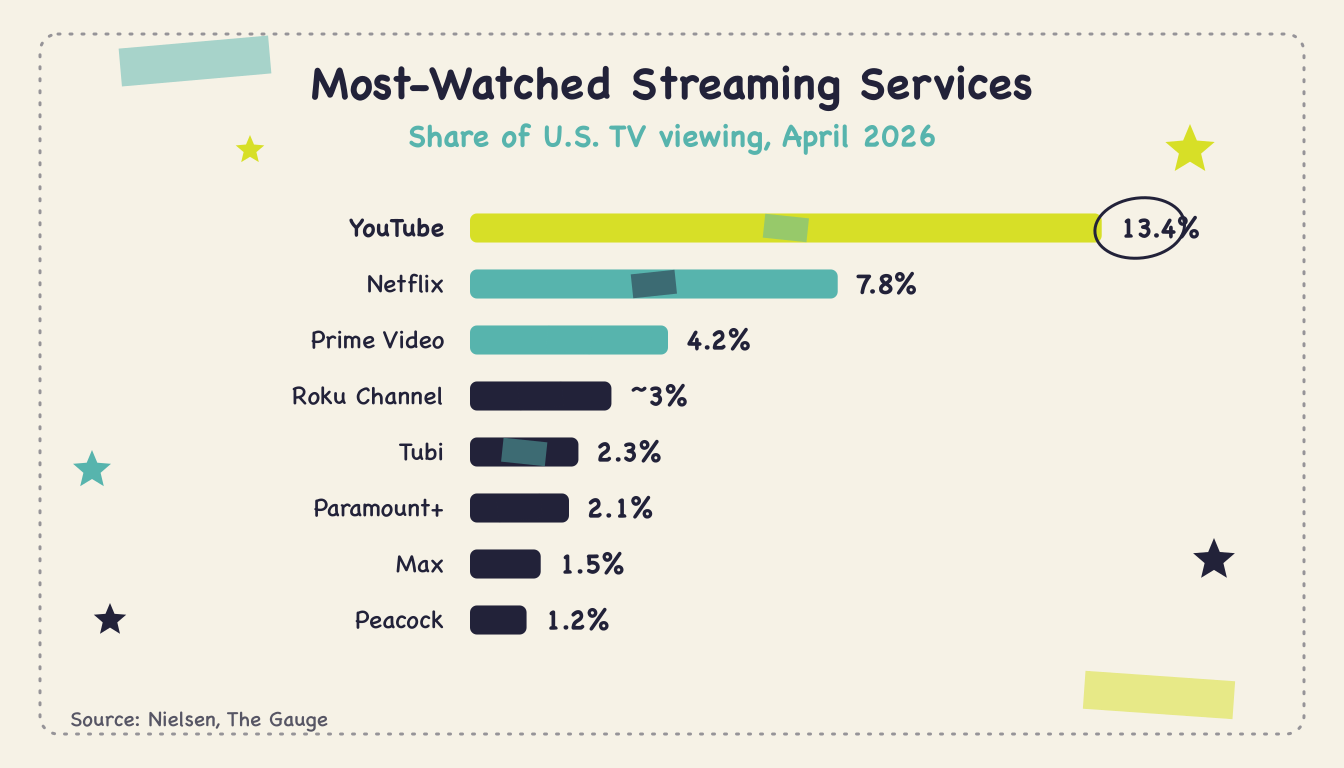
Here are the top streaming services by share of total U.S. TV viewing in April 2026:
YouTube: 13.4% (the runaway leader)
Netflix: 7.8%
Amazon Prime Video: 4.2%
Roku Channel: about 3%
Tubi: 2.3% (a platform-best share)
Paramount+: 2.1%
Max: 1.5%
Peacock: 1.2%
One note on the ranking, because it's a common point of confusion. Nielsen reports some services individually and rolls Disney's streaming, meaning Disney+, Hulu, and ESPN+ together, into a combined figure of roughly 5% rather than breaking out Disney+ and Hulu separately. So Disney's streaming portfolio as a bundle would slot near the top, but its individual apps aren't published as standalone numbers. We're not going to invent them. The individually reported services above are the verified ranking.
The scale of YouTube's lead is worth pausing on. At 13.4%, YouTube pulls nearly 1.7 times Netflix's viewing and more than the next four services (Prime Video, Roku Channel, Tubi, Paramount+) combined. It has been Nielsen's number-one streaming service by watch time for roughly two years running. All of this sits inside a streaming category that took a record 47.6% of U.S. TV viewing in April, more than cable and broadcast put together. For the wider view, our streaming's share of TV viewing overview traces how the category got here.
A timing note: April is the last month Nielsen has fully reported as of late July 2026. Nielsen delayed its March Gauge amid a dispute over new measurement methodology, and the recalibrated version isn't expected until the fall. Every figure here reflects data through April 2026.
How Nielsen measures this, and why April is the latest number
The ranking comes from Nielsen's national panel, the same measurement behind its TV ratings, which tracks actual viewing on television sets across a representative sample of U.S. households. The Gauge divides that total across broadcast, cable, streaming, and other, and names the streaming services inside the streaming slice. Because the method is consistent month to month, changes in the ranking reflect real shifts in what people watch.
The reporting calendar hit some turbulence this year, which is worth understanding so the numbers make sense:
Reporting period: April 2026. The rankings below use Nielsen’s published data for that month.
A methodology reset is coming in the fall. Nielsen delayed its March Gauge and is moving to a recalibrated approach expected around the start of the fall season. It's projected to lift broadcast and cable slightly and trim streaming, so the individual shares could shift a bit when the new numbers land, even without real changes in viewing.
Two Nielsen products, one ranking. The Gauge ranks individual services, which is what we use here. A separate Media Distributor Gauge ranks whole parent companies and produces different numbers. We're using the individual-service view, the right one for "which streaming service has the most viewers."
None of this unsettles the headline. YouTube is the most-watched streaming service by a wide margin, Netflix is a clear second, and the ad-supported services below them are climbing.
Breaking down the numbers
The ranking rewards a closer look, because the movement underneath it tells you where advertising attention is flowing. The year-over-year shifts show which services are gaining ground.
Comparing April 2026 to a year earlier, the gainers and laggards sort out like this:
Rising fastest: YouTube (up about a full point), Amazon Prime Video, and the free ad-supported services Roku Channel and Tubi
Holding steady: Netflix and Peacock posted small gains; Disney's streaming and Max held roughly flat
Slipping slightly: Paramount+ and Pluto TV together gave back a fraction of a point
The standout theme is the rise of free, ad-supported streaming. Tubi hit a platform-best 2.3% share, and the Roku Channel climbed to around 3%, both fully ad-supported services with no subscription at all. These aren't premium subscription apps, they're free television paid for entirely by ads, and they're taking a growing slice of the most-watched ranking. Our free ad-supported streaming share breakdown digs into that growth. When free ad-supported services climb the ranking, it means more premium living-room inventory is opening up to advertisers.
That leads to the single most useful distinction in this whole ranking, one that trips up almost everyone: the service with the most viewers is not the service with the most subscribers.
Viewers versus subscribers: they're not the same thing
"Most-watched" and "most-subscribed" measure two completely different things, and mixing them up leads to bad conclusions. Here's the clean version.
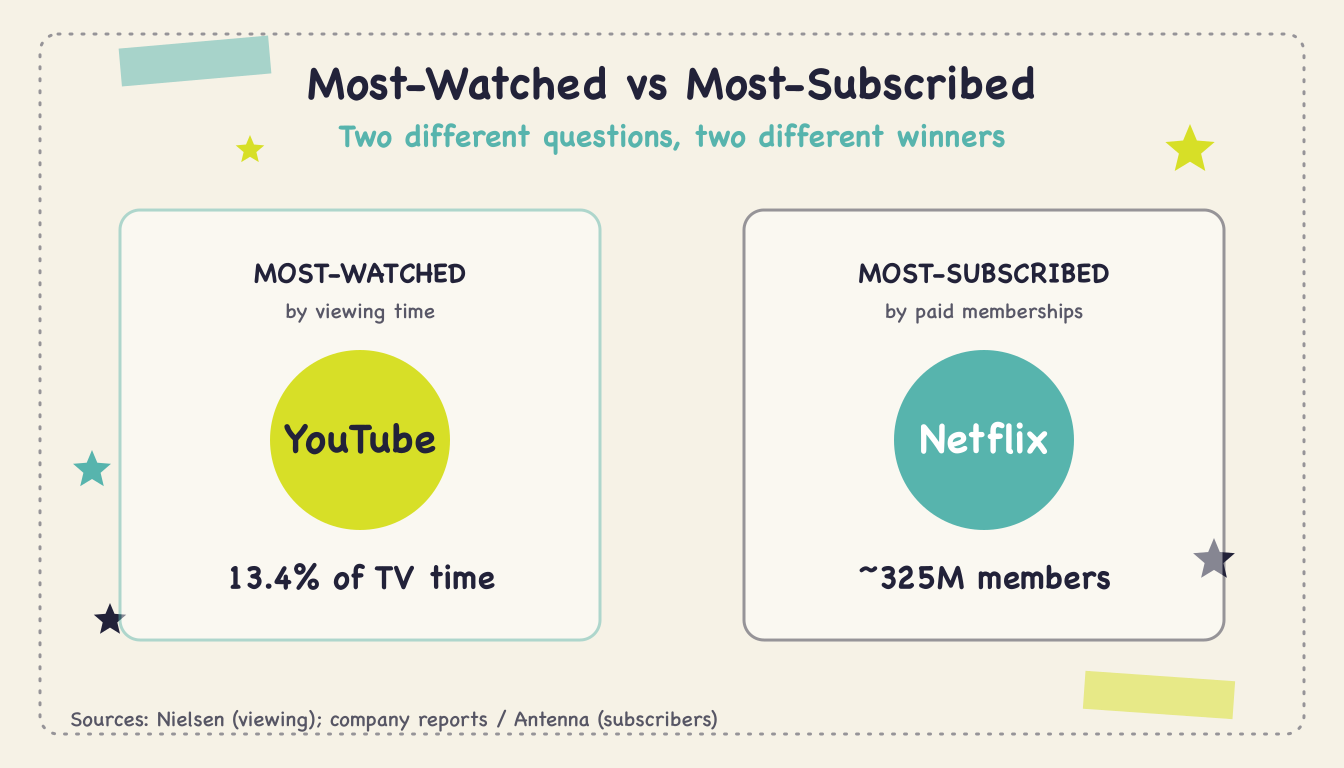
Most-watched (by viewing time): YouTube, at 13.4% of U.S. TV viewing. YouTube is free and ad-supported, so it rarely tops subscriber charts, but it wins decisively on the hours people spend watching.
Most-subscribed (by paid memberships): Netflix, with roughly 325 million global subscribers and the largest share of U.S. premium streaming subscriptions. Netflix wins the paid-subscription race but trails YouTube on total watch time.
Why the gap? YouTube's enormous free library and living-room reach rack up viewing hours without a subscription, while Netflix's model is built on paid memberships. Both are dominant, but on different scoreboards. For advertisers, the watch-time ranking is the one that matters, because ads run against viewing, not against sign-ups. The service being watched the most is the one delivering the most ad impressions. For the head-to-head, our Netflix Q1 2026 viewing share and YouTube Q1 2026 viewing share posts break down the top two.
There's a practical lesson buried in that distinction. If you were choosing where to advertise based on subscriber headlines, you'd fixate on the paid services and miss where attention concentrates. A free, ad-supported service like Tubi or the Roku Channel carries no subscription at all, yet each pulls real viewing share, and every minute of it is ad-supported. A subscriber count tells you how many people pay for a service. A viewing share tells you how many hours they spend inside it, and hours are what your ad runs against. When you plan a connected TV campaign, follow the watch-time ranking, not the subscriber leaderboard.
Why it matters for your business
The most-watched ranking is really a map of where attention lives, and for a small business, attention is what you're buying. The useful insight isn't just that YouTube leads, it's that nearly every service on the list is now reachable with ads.
Consider what the ranking means practically:
The whole top of the list is ad-supported. YouTube runs ads natively, Prime Video defaults to an ad tier, Tubi and Roku Channel are entirely free and ad-supported, and Netflix, Peacock, Paramount+, Max, Disney+, and Hulu all carry ad tiers now. The most-watched services are, almost without exception, addressable connected TV advertising inventory.
Free ad-supported services expand your reach cheaply. The rise of Tubi, Roku Channel, and Pluto means a growing pool of premium living-room inventory that exists purely to run ads, which tends to price efficiently for local advertisers.
Concentration makes buying simpler. A handful of services command most streaming viewing, so reaching a lot of people no longer means stitching together dozens of local cable buys. One connected TV campaign can span the top services at once.
The old world sorted TV into "premium and unreachable" and "affordable and low-quality." The most-watched ranking erased that line. The services people watch, the biggest names on the biggest screen, are the same ones a small business can now advertise across. The connected TV advertising market grew up precisely to serve advertisers reaching this audience.
It's also worth noticing how concentrated the attention is. The top two services, YouTube and Netflix, together account for more than a fifth of all U.S. TV viewing, and the top eight streaming services cover the large majority of streaming time. For an advertiser, concentration is a gift: you don't have to be everywhere to reach nearly everyone. A campaign that runs across the handful of dominant services lands in front of most of the streaming audience without the fragmentation that made local cable buying such a chore. The most-watched ranking isn't just trivia about who's winning, it's a shortlist of exactly where a limited budget should point.
How to take advantage
Knowing YouTube leads and the free services are climbing is useful. Turning it into customers is the point. You don't buy the ranking service by service, you reach the audience across it. Here's how a small business acts on the data.
Reach across the top services. Your customers spread their viewing across YouTube, Netflix, Tubi, Roku Channel, and more on any given night. Running across the whole ecosystem is how you build the frequency any single app can't deliver.
Target your service area. Set a geographic radius, usually 15 to 25 miles, so every impression lands on someone who could walk in or call.
Budget for repetition. Plan enough spend to reach the same households several times over two to three weeks. On connected TV, real frequency costs hundreds of dollars, not thousands.
Approve the ads before you spend. Check the offer, the town, and the page people will hit next. A first-party site tracker is what ties later visits back to the campaign.
Track brand lift. Measure branded search, direct traffic, and calls during and after a campaign instead of chasing clicks, since TV builds demand you capture elsewhere.
Adwave runs paid media on Meta, Google, TikTok, Reddit, web, and TV from $30/day prepaid, with local radius or ZIP targeting and a first-party site tracker. Individual signups typically get a $60 starter credit. You approve ads before you spend. Cost bands for television are on the average CTV CPM page.
The bigger picture
The most-watched ranking is a snapshot of a market that reorganized itself around a few dominant, ad-supported services, and that consolidation is exactly what makes connected TV work for small advertisers.
A few forces give the Q2 2026 ranking its weight:
Ad-supported won. Almost every service in the top ranking is ad-supported or offers an ad tier, and viewers keep choosing those tiers when given the option. The premium-versus-ad-free debate is settled: audiences accept ads on premium streaming, which is the foundation of affordable CTV. Our ad-supported streaming viewers page tracks how large that audience has grown.
Free TV is back, on streaming. The climb of Tubi, Roku Channel, and Pluto shows free ad-supported television returning in a modern form, adding inventory that prices well for local businesses.
Streaming owns the TV day. The ranking sits inside a streaming category that took a record 47.6% of all TV viewing in April 2026, more than cable and broadcast combined. The most-watched services are streaming services, full stop.
For small businesses, the throughline is reach with access. The services Americans watch most are no longer walled gardens for national brands. They're an open, ad-supported market a corner shop can buy into. The names changed, the screens got bigger, and the door finally opened.
What experts are saying
Nielsen's own framing has been consistent: YouTube is the most-watched streaming service, and it has held that spot for roughly two years as living-room viewing became its fastest-growing surface. Analysts point to YouTube's 1 billion-plus daily hours of connected TV watching as the engine behind its Gauge dominance, a scale no subscription service matches on watch time.
The other story analysts keep flagging is the rise of free ad-supported streaming. When Tubi posts a platform-best share and the Roku Channel climbs into the top handful of services, it signals that viewers are comfortable trading a few ads for free premium content, and that advertisers now have a deep pool of living-room inventory to reach them. Measurement firms like Antenna have documented consumers actively opting into ad-supported tiers when offered the choice. The consensus read for advertisers is that the most-watched ranking has become, in effect, a menu of ad-reachable audiences, and the biggest names on it are the most accessible they've ever been. A decade ago, this same list of top services would have been a wish list of untouchable premium inventory. Today it's a buy sheet a local business can act on for the price of a modest weekly ad budget.
What the ranking doesn't tell you
The ranking is clear, but read it with a few caveats so you plan around reality.
Watch time isn't the same as your customer. YouTube leading total viewing doesn't mean it's where your specific buyers are most reachable. The value of connected TV is targeting your audience across services, not chasing the single biggest number.
Some shares are rounded or bundled. Roku Channel's roughly 3% is a rounded figure, and Disney's streaming is reported as a combined bundle rather than split into Disney+ and Hulu. Treat those as approximate, and don't read false precision into them.
The fall recalibration may reshuffle the shares. When Nielsen's new methodology lands, streaming shares may dip slightly against broadcast and cable. The ranking order is unlikely to change much, but the exact percentages could.
Viewers and subscribers stay separate. Don't collapse the two. YouTube wins viewers, Netflix wins subscribers, and confusing them leads to the wrong media plan.
Read the ranking as a map of ad-reachable attention: a handful of dominant, ad-supported services command most of streaming, and reaching across them is what a smart connected TV budget does.
Common questions answered
YouTube accounted for 13.4% of all U.S. TV viewing in April 2026, according to Nielsen's The Gauge. It led individual streaming, cable, and broadcast services and had held the top streaming position by watch time for roughly two years.
Is Netflix or YouTube bigger? It depends on the metric. YouTube is bigger by viewing time, at 13.4% to Netflix's 7.8% of U.S. TV viewing. Netflix is bigger by paid subscriptions, with roughly 325 million globally. YouTube wins the hours people watch, Netflix wins the paid memberships, so both are "biggest" on different scoreboards.
Which free streaming services are most-watched? Among free, ad-supported services, the Roku Channel leads at around 3%, followed by Tubi at a platform-best 2.3%. Both are fully free and ad-supported, and both grew year over year. Pluto TV is also a significant free service, though Nielsen reported it bundled rather than standalone in April 2026.
Can a small business advertise on these streaming services? Where the service sells ads, yes, a local flight can include television with search and social. Adwave starts at $30/day prepaid. National viewing share is not the same thing as a campaign in your ZIP codes.
How much does it cost to advertise on streaming? The average CTV CPM page uses a rough $15 to $35 planning band. Adwave media starts at $30/day. The April ranking above is context for where viewing time went, not a rate card.
The numbers at a glance
The Q2 2026 most-watched streaming ranking, with sources:
13.4%: YouTube, the most-watched streaming service, April 2026 (Nielsen, The Gauge)
7.8%: Netflix, the number-two streaming service (Nielsen, The Gauge)
4.2%: Amazon Prime Video, number three (Nielsen, The Gauge)
~3%: Roku Channel, the top free ad-supported service (Nielsen, rounded)
2.3%: Tubi, a platform-best share (Nielsen, The Gauge)
2.1% / 1.5% / 1.2%: Paramount+, Max, and Peacock (Nielsen, The Gauge)
~5%: Disney's streaming combined (Disney+, Hulu, ESPN+), not broken out individually (Nielsen)
47.6%: Total streaming share of U.S. TV viewing, a record (Nielsen, The Gauge)
~325M: Netflix global subscribers, the most-subscribed service (company reports, Antenna)
Reach living-room screens from $30/day
In the April table, YouTube leads on viewing time and Netflix leads on paid subscriptions. Several of the named services sell ads. Adwave includes TV with search and social from $30/day, with a first-party site tracker. See pricing for the current floor. Every rank on this page is April 2026.