YouTube, the video platform, held 13.4% of all U.S. TV viewing in April 2026, the month in Nielsen's The Gauge published June 25, 2026. That is YouTube's share of time on television sets, cable and broadcast included. It is not YouTube TV, the paid live-TV subscription, and it is not YouTube's share of phone or desktop viewing. Disney sat second at 10.3% in that same April distributor ranking.
On Adwave, a TV campaign, including YouTube, starts at $30 a day. Google Search starts at $67 a day. See pricing. The Nielsen shares below are YouTube on TV screens.
What the data shows
Nielsen's The Gauge is the closest thing the industry has to an official scoreboard for TV. Every month it splits total U.S. television viewing into broadcast, cable, streaming, and "other," then names the platforms and companies driving each slice. In the April 2026 report, released June 25, 2026, YouTube came in at 13.4% of total TV viewing, holding the top distributor spot it first claimed in mid-2025.
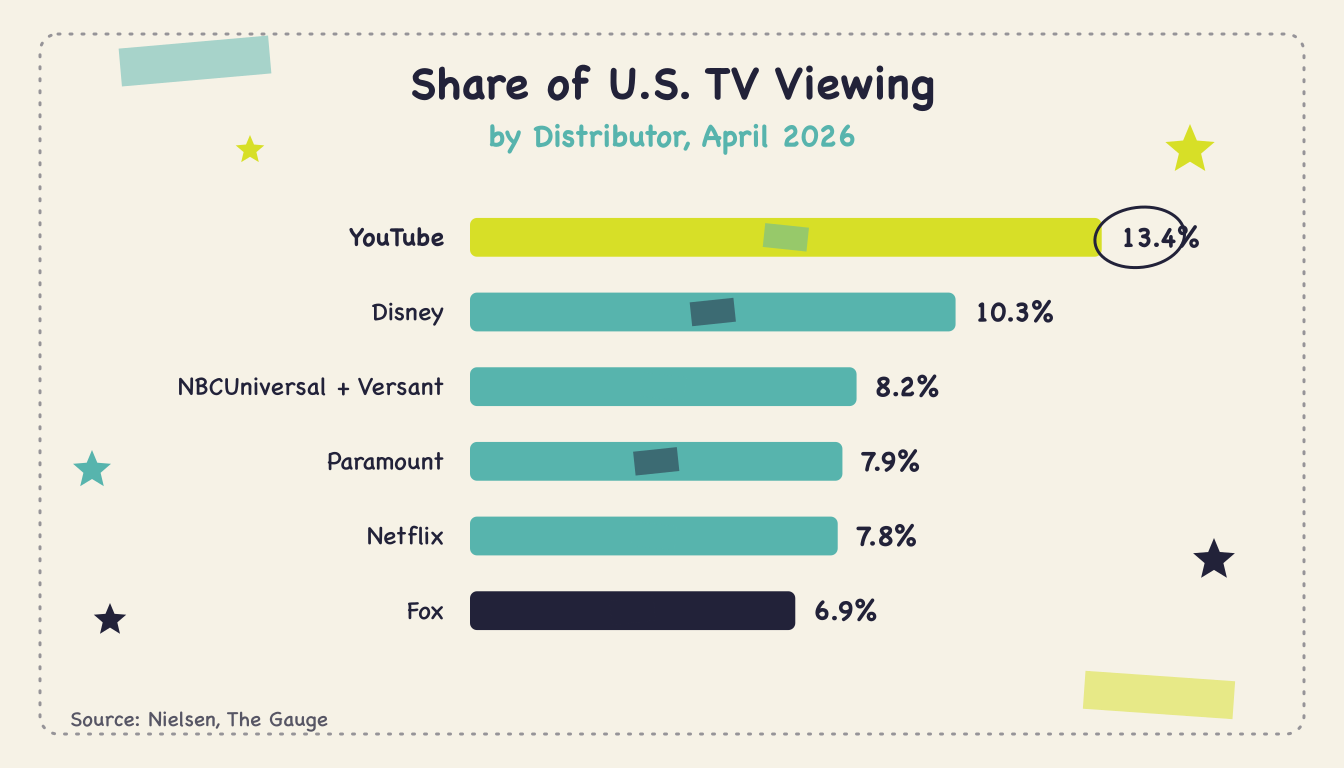
To put the field in order, here's how the major distributors ranked in April 2026 by share of total TV time:
YouTube: 13.4% (first place, sixth straight month on top)
Disney: 10.3%
NBCUniversal + Versant: 8.2% combined
Paramount Skydance: 7.9%
Netflix: 7.8%
Fox Corp: 6.9%
Two things stand out. First, YouTube's lead over Disney is more than three full percentage points, which in Gauge terms is a chasm. Second, YouTube is a single property doing this. Disney's 10.3% bundles Disney+, Hulu, ESPN, ABC, and its cable networks. YouTube's 13.4% is just YouTube. When you strip the comparison down to one platform against entire corporate portfolios, the scale of YouTube's living-room reach is hard to overstate.
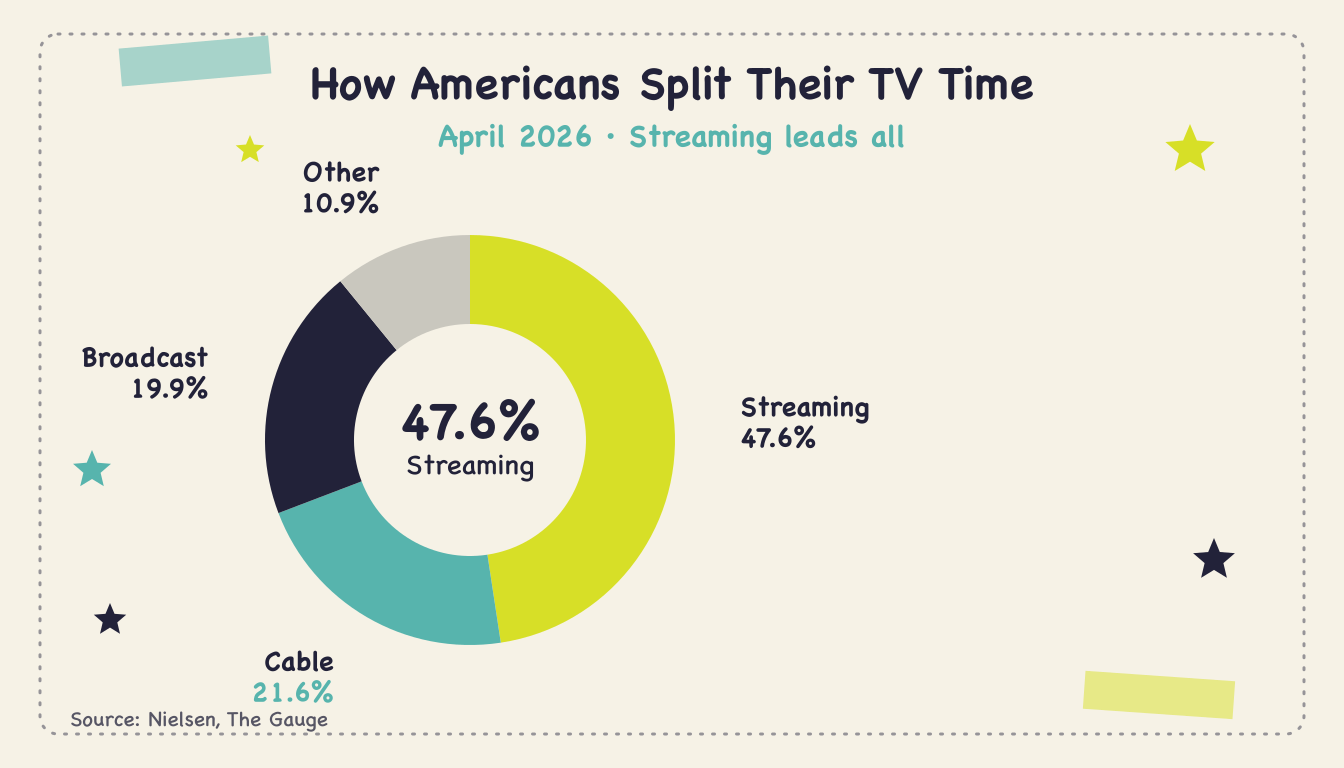
Zoom out to the category level and the streaming story is just as clear. Streaming as a whole took **47.6% of U.S. TV viewing in April 2026**, up from 44.3% a year earlier. Cable held 21.6% and broadcast 19.9%. Streaming now commands more of the TV day than cable and broadcast combined, and YouTube alone accounts for more than a quarter of that streaming total. If you want to understand how streaming overtook the traditional bundle, our breakdown of streaming's share of TV viewing traces the full shift.
One caveat worth stating plainly, because it shapes every number here: April is the freshest Gauge data available as of late July 2026. Nielsen delayed its March report amid a dispute over its new measurement methodology, and the recalibrated Gauge isn't expected until the fall. So when we say 13.4%, we mean April 2026, the last fully published figure, not a May or June estimate. We don't guess at months Nielsen hasn't reported.
How Nielsen measures this, and why April is the latest number
Where does 13.4% come from, and why is April the newest number in late July? Both questions have real answers this quarter. Nielsen's The Gauge is built from the same national panel that produces its TV ratings, measuring actual viewing on television sets across a representative sample of U.S. households. Each month's report typically lands about six to eight weeks after the month closes, which is why, in late July, April is the freshest complete picture.
This year the cadence slipped further than usual. Nielsen delayed its March 2026 Gauge amid an industry dispute over a new measurement methodology it had begun rolling out, and it has signaled that the recalibrated approach won't fully arrive until the start of the fall season. The practical effect for anyone reading these numbers is simple:
April 2026 is the last fully reported month. Treat 13.4% as the current, confirmed figure, not a stand-in for May or June.
Month-to-month wobble is normal. A single big live event can swing a month by a point or more, so trends matter more than any one reading.
The methodology debate itself is a signal. Streamers pushing back on measurement changes is a sign of how high the stakes have gotten now that streaming owns the TV day.
None of this changes the headline. Across every recent month Nielsen has reported, YouTube sits comfortably in first, and the device trend underneath it, viewing moving from phones to TV screens, is measured consistently regardless of the fall recalibration.
Breaking down the numbers
A single headline percentage hides a lot of movement underneath. YouTube's path through the first half of 2026 was not a straight line, and the month-to-month shifts tell you something about how live events still move the needle.
Here's how YouTube's share tracked across the reported months of 2026:
January 2026: YouTube at 12.7% of U.S. TV time (Nielsen The Gauge). YouTube on TV screens, not the YouTube TV subscription. See the Q1 2026 note.
February 2026: YouTube at 12.7%. NBCUniversal-Versant reached 13.1% in the Media Distributor Gauge, on Super Bowl LX and the Winter Olympics. Same entity: YouTube on TV screens. The Q1 note is the writeup for that month.
March 2026: Nielsen had not published this month when this page was written. No March share is stated here.
April 2026: YouTube at 13.4% of total U.S. TV viewing (Nielsen The Gauge, published June 25, 2026).
February is the month a stack of live sports, the Super Bowl plus the Winter Olympics, put NBCUniversal-Versant ahead of YouTube on the distributor ranking. April's published Gauge has YouTube at 13.4%. This page does not fill in March. Live sports remain broadcast and cable's strongest card. Our look at live sports as a share of TV viewing covers why those events still draw large audiences.
Year over year, YouTube's trajectory is steady growth. It ran around 12% to 12.5% in early 2025, climbed to a summer peak of 13.4% by July 2025, and is holding near that peak in 2026. Depending on which Nielsen product you read, April 2026 is up either 0.2 points (The Gauge's total-TV framing) or about a full point (the Media Distributor Gauge framing) versus the prior April. Either way, the direction is up while the audience keeps shifting from scheduled TV to on-demand. For the quarter-ago baseline, our YouTube Q1 2026 viewing share post captured the 12.7% reading from the start of the year.
The device story underneath these numbers matters just as much as the share. YouTube's growth isn't coming from phones. It's coming from the biggest screen in the house.
Why it matters for your business
It's easy to read a stat like "13.4% of TV viewing" as media-industry trivia. For a local business deciding where ad dollars go, it's a practical signal about attention. People are spending more of their TV time on platforms that were built for advertising from day one, and less on channels that were built for cable subscriptions.
Consider what YouTube's living-room dominance means concretely:
The audience is on the TV, not the phone. More than 1 billion hours of YouTube get watched on TV screens in the U.S. every day, and the living room is now YouTube's single largest viewing device. This is couch viewing, full-screen and lean-back, not a thumbnail glanced at during a commute.
Connected TV is where the growth is. Over 44% of U.S. YouTube watch time now happens on connected TV, up from around 41% in 2022. The trend line points at the television, which is exactly the screen small businesses were locked out of for decades.
The inventory is buyable. Unlike a national network upfront, connected TV ad inventory is available to any advertiser at any budget. You're reaching the same premium audience without the premium gatekeeping.
That last point is the heart of it. For most of TV history, the barrier wasn't the audience's willingness to watch ads, it was the cost of entry. National spots ran into the tens of thousands of dollars, and local cable buys came with minimums and sales reps. Connected TV knocked that barrier down. The same viewers driving YouTube to the top of the Gauge are reachable through connected TV advertising at budgets a corner shop can afford.
How to take advantage
Knowing YouTube owns the living room is useful. Turning that into customers is the part that pays. You don't need a YouTube-specific strategy so much as a connected TV strategy that meets viewers on the screen where they now spend nearly half their TV time. Here's how a small business can act on this data.
Start with your service area. Geographic targeting keeps every impression inside the radius you serve, usually 15 to 25 miles around your location. There's no point paying to reach viewers three states away.
Budget for frequency, not just reach. A single impression rarely moves anyone. Plan enough spend to reach the same households several times over two to three weeks so your name sticks. On connected TV, that's achievable on a few hundred dollars, not a few thousand.
Let the platform handle creative. You don't need a production crew. AI tools can turn your existing website into a broadcast-quality 30-second ad in about two minutes, which removes the single biggest cost that used to keep small businesses off TV.
Run across the whole ecosystem, not one app. The viewers on YouTube's living-room feed are the same people watching Hulu, Roku, and free ad-supported channels. Buying more than one of those apps builds frequency that one app cannot.
Measure brand lift, not clicks. TV ads aren't clickable, so track the right signals: branded search volume, direct website traffic, and lift in calls or foot traffic during and after a flight. QR codes on screen can bridge to direct response when you want it.
On Adwave, you can review ads before you add a card, and a TV campaign, including YouTube, starts at $30 a day. Google Search starts at $67 a day. See pricing. That buy can include YouTube on TV screens. It is not a YouTube TV subscription. If you want the fuller playbook, our guide to YouTube advertising for small business walks through the options, and our CTV vs YouTube ads comparison helps you weigh where a given budget works hardest.
The bigger picture
YouTube's 13.4% is a snapshot of a much larger migration. American television is finishing a decade-long shift from a schedule you tuned into toward a library you call up on demand, and the platforms winning that shift were all designed with advertising baked in.
A few trends give the April 2026 number its context:
Streaming was 47.6% of TV viewing in April 2026, more than cable and broadcast combined (41.5%). Our cord-cutting statistics page tracks the households leaving cable behind.
YouTube is a business, not just a viewing habit. YouTube ad revenue hit $9.88 billion in the first quarter of 2026, up nearly 11% year over year, and full-year 2025 ad revenue topped $40 billion. That's the scale of demand chasing this audience, and it's a signal that the attention is monetizing, not just accumulating.
The living room is the battleground. YouTube TV, the paid live-TV service, has crossed 10 million subscribers and is on track to become one of the largest pay-TV providers in the country. Even YouTube's own live-TV bundle is pulling cord-cutters back into a TV-like product, on a connected device.
For small businesses, the throughline is that the tools finally match the audience. The viewers consolidated onto a handful of connected TV platforms, and the ad-buying got simple enough that a one-person shop can run a real TV campaign. The connected TV advertising market is expanding for exactly this reason: demand from advertisers who were priced out of TV for a generation. What used to be a Fortune 500 channel is now a small-business channel.
What Nielsen, Alphabet, and MediaPost reported
Nielsen's April 2026 Gauge, published June 25, 2026, said YouTube added 0.2 points and stayed at the top of the Media Distributor Gauge with 13.4% of total watch time.
On Alphabet's Q1 2026 earnings call, CEO Sundar Pichai said U.S. viewers are watching over 200 million hours of YouTube a day in the living room (Alphabet, April 29, 2026).
MediaPost, on the same April 2026 distributor ranking, said a combined Fox and Roku would have a 9.9% share, third behind Disney. YouTube's share in that report is 13.4%.
What the number doesn't tell you
A 13.4% share is a powerful headline, but read it with a few caveats so you plan around what's real rather than what's implied.
Share isn't the same as your customer. YouTube leads total TV viewing, but "total" spans everyone. Your buyers are a slice of that, defined by geography, age, and interest. The value of connected TV for a small business isn't raw reach, it's targeted reach inside your service area.
A platform's share isn't a media plan. Owning the top spot on the Gauge tells you where attention is, not how to buy it efficiently. In practice, the smart move is running across many connected TV apps at once, because your local audience is split across YouTube, Roku, Hulu, Tubi, and more on any given night.
Viewing share doesn't equal ad availability at your budget. Some premium content carries little or no ad load. What matters for a small advertiser is ad-supported inventory, which is exactly what the connected TV ecosystem delivers in volume. Our look at ad-supported streaming viewers covers how much of this audience is reachable with ads.
Monthly numbers move. February's live-sports dip proved a single month can shift the rankings. Build campaigns around the durable trend, viewing moving to the connected TV screen, not around one month's leaderboard.
Read the 13.4% as a directional signal: the audience has concentrated on connected TV, and it's reachable. That's the part that should shape your budget.
Common questions answered
Is YouTube really the most-watched platform on TV? By Nielsen's measure of total U.S. TV viewing, yes. YouTube took 13.4% of all TV time in April 2026, ahead of every other single distributor, and it has led for six consecutive months. It's worth being precise: this counts viewing on television sets, so it reflects living-room watching, not phone or desktop time. YouTube has also been Nielsen's top streaming platform by watch time for about two years.
How is YouTube's share different from Netflix's? In April 2026, YouTube held 13.4% of TV viewing while Netflix held 7.8%. Netflix is premium on-demand series and film. YouTube carries creator videos, music, and full shows, much of it free with ads. Our Netflix vs YouTube viewers comparison breaks down how the two platforms stack up.
Why did YouTube trail in February 2026? Live sports. The Q1 note reports YouTube at 12.7% of U.S. TV time in February 2026 and NBCUniversal-Versant at 13.1%, on Super Bowl LX and the Winter Olympics. March was not published. In April 2026, YouTube was at 13.4% (Nielsen The Gauge, published June 25, 2026). All of those YouTube shares are the video platform on TV screens, not the YouTube TV subscription.
Can a small business advertise on connected TV? Yes. On Adwave, a TV campaign, including YouTube, starts at $30 a day. Google Search starts at $67 a day. See pricing. The 13.4% is YouTube on TV screens in April 2026, not a count of YouTube TV subscribers.
What does 13.4% mean for my ad budget? It is YouTube's share of U.S. TV time in April 2026 (Nielsen The Gauge). It is not a media price. For the 2026-27 primetime upfront streaming CPM, see the average CTV CPM.
The numbers at a glance
Key figures behind YouTube's Q2 2026 standing, with sources:
13.4%: YouTube (the video platform on TV screens, not the YouTube TV subscription) share of total U.S. TV viewing, April 2026 (Nielsen, The Gauge, published June 25, 2026)
47.6%: Streaming's total share of U.S. TV viewing, April 2026, up from 44.3% a year earlier (Nielsen, The Gauge)
21.6% / 19.9%: Cable and broadcast shares of TV viewing, April 2026 (Nielsen, The Gauge)
10.3%: Disney's distributor share, second place behind YouTube (Nielsen, Media Distributor Gauge, April 2026)
1 billion+: Hours of YouTube watched daily on U.S. TV screens (Google/YouTube)
44%+: Share of U.S. YouTube watch time now on connected TV, up from ~41% in 2022 (eMarketer, via TechCrunch, April 2026)
$9.88 billion: YouTube ad revenue, Q1 2026, up ~11% year over year (Alphabet earnings, April 29, 2026)
$40.4 billion: YouTube full-year 2025 ad revenue (Alphabet earnings)
10 million+: YouTube TV (vMVPD) subscribers (Alphabet/Cord Cutters News)
Reach the living-room audience, from $30/day
YouTube's climb to the top of the Nielsen Gauge is really a story about where attention went: to the connected TV screen, on ad-supported platforms, in full-screen living-room viewing. The good news for small businesses is that the same shift that made YouTube the most-watched name on TV also opened that screen to advertisers of every size.
See pricing. A TV campaign, including YouTube, starts at $30 a day. Google Search starts at $67 a day. The 13.4% above is YouTube on TV screens in April 2026, not the YouTube TV subscription.