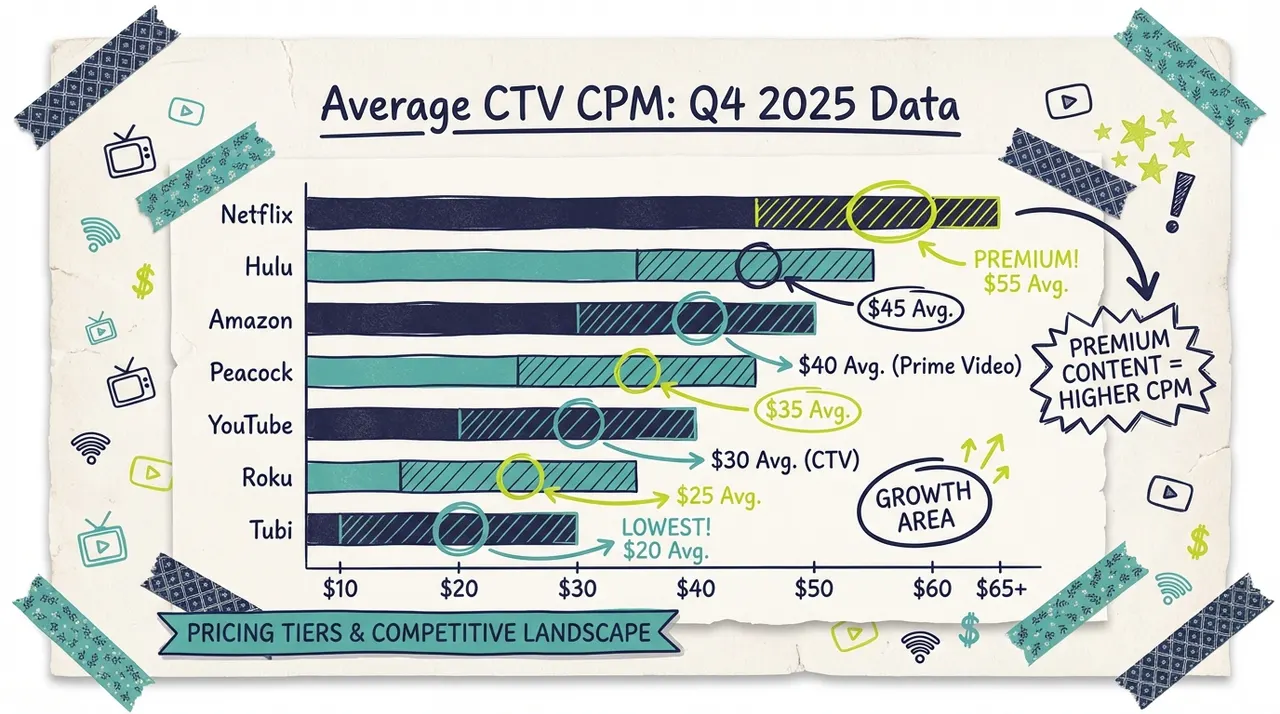
Average CTV CPM is the typical cost to deliver 1,000 ad impressions on connected TV (streaming TV on a television screen). Industry analysis cited on this page (AI Digital) puts the working range around $20-$40, with many campaigns settling near ~$25. Keynes Digital's analysis cited here puts the median closer to $20-$35. Premium inventory and tight targeting push higher; broad or FAST-style buys often land lower.
Those are planning figures from named industry sources and on-page bands, not a single official rate card. Your live CPM still moves with platform mix, geo, season, format, and how you buy.
This page answers one question: what does the average CTV CPM look like, and what changes it? For a platform-by-platform table (Netflix, Hulu, Pluto, and the rest), use our TV advertising CPM by platform refresh. Keep the two pages separate so searchers who want "the average" do not get a logo grid, and searchers who want "by platform" do not get only a single range.

What "average CTV CPM" means
CPM = cost per mille (cost per 1,000 impressions). If your CPM is $25, every $25 of media buy delivers about 1,000 impressions.
CTV CPM is usually higher than many social video auctions because you are buying full-screen, sound-on inventory in a lean-back living-room context, often with very high completion versus skippable feeds. It is still reachable for small budgets when you buy locally and size the flight to learning.
A few labels that get mixed up:
Average / median range: the "what do most buys look like?" answer this page owns (~$20-$40, often ~$25).
Platform averages: logo-level benchmarks. Those live on the CPM-by-platform page.
Your quote: what you pay after targeting, season, and inventory. Expect it to sit somewhere inside (or above) the planning band, not exactly on the headline average.
Operators get into trouble when they treat the average as a promise. The average is a planning midpoint. Your flight can clear above it in Q4 with tight targeting, or below it on broad FAST inventory in a quiet month. Build the spreadsheet with a band, then update it with your real delivery reports.
Why CTV CPMs compressed into late 2025
On-page trend narrative (kept, re-sourced as planning context):
2023 to early 2024: Premium CTV often priced in a ~$35-$50 band when ad-supported streaming inventory was tighter.
Mid-2024 through 2025: More ad tiers and FAST supply (Marketing Architects' "inventory glut" framing cited on the live page) pushed mid-tier averages toward roughly ~$25-$35.
Heading into 2026 (planning outlook on-page): Base inventory often planned around ~$20-$25, with premium targeting and placement still able to command ~$40-$60.
Q4 still tends to price higher than Q1. Political years and tentpole windows add local spikes. Treat the average as a map, then price the buy you run.

Supply growth is only half the story. Buyer demand still spikes around holidays, sports, and elections. That is why a single annual average misleads. Keep a Q4 planning premium in your model, and keep a Q1 opportunity note for when inventory loosens.
What usually raises or lowers CTV CPM
Raises CPM (common on-page planning notes)
Q4 and peak demand: holiday competition; on-page planning note of roughly 20-40% seasonal lift versus quieter periods.
Prime dayparts: evening TV windows often price higher than daytime (on-page note of roughly 30-50% for prime versus daytime).
TV-screen-only device filters: smart-TV inventory is scarcer than "any device streaming" (on-page note of roughly 15-25% lift when you lock to TV screens).
Genre or premium content locks: sports, news, or premium drama pools are smaller.
Stacked audience layers: first-party match, lookalikes, purchase intent, and retargeting sit at the top of the targeting ladder below.
Lowers effective CPM
Flexible dayparts and longer flights
Broader geo or demo when reach is the job
FAST / broader run-of-network when you need volume
Off-peak seasons (often Q1)
Programmatic aggregation versus premium direct-only deals (trade-offs on control and inventory class)
CPM by targeting type (planning bands)
Climb the ladder only as far as your margin allows. Each added targeting layer can raise CPM. Buy the precision you can prove you need, then stop.
These bands are the targeting ladder already on the live page. They are planning ranges, not quotes.
Paramount advertising insights cited on the live page note that campaigns can start near a low base (about $7 in that Paramount example) and rise as targeting layers stack. The lesson for SMBs: start with the geo and demo you need, then tighten only when the data says the wider net is wasteful.

Budget math: impressions from a CTV CPM
Keep three CPM assumptions in every planning sheet so quotes are easy to challenge. If a proposal only works at an unrealistically low CPM, the plan is fragile.
Formula: impressions = (budget / CPM) x 1,000.
Adwave product planning on related resources cites a typical SMB CTV band around $15-$35 CPM with an ~$25 average for many small-business campaigns, and campaigns that can start from $30/day (individual signups typically get a $60 starter credit). Older on-page copy also referenced a $50 low starting point; use the live product floor at publish time.
For local businesses, even a few hundred dollars can produce thousands of in-market impressions when geo is tight. That is the practical reason CTV averages matter more than national folklore about "TV being impossible."
How CTV CPM compares to other channels (context, not a rate card)
Use these as directional comparisons already framed on the live page, then judge completion and outcomes, not CPM alone.
CTV's case is rarely "cheapest CPM." It is completed, living-room video with measurable delivery when you buy through a modern platform. For efficiency frameworks beyond cost-per-thousand, see advertising effectiveness measurement and TV advertising ROI.
When finance asks why CTV costs more than a social auction, answer with outcomes: completed views, local reach, and assisted conversions. Bring the impression math and the geo story. That conversation goes better than defending a single CPM cell.
Platform detail lives on E1 (intentional split)
If a vendor deck leads with logo-level CPMs, bring them back to your average and your geo. Platform rows are useful context. They are not a substitute for the flight you will run.
You will see Netflix, Hulu, Roku, Tubi, and others quoted across the web. This page does not own the platform-by-platform table. That comparison (including Ad Age agency averages used in the Sep 15 refresh) lives here:
On-page Simulmedia-style platform ranges from the prior version of this URL (for example Netflix programmatic vs direct bands, Hulu, Prime Video, Peacock, Paramount+, YouTube CTV, Roku, Tubi/Pluto) remain useful as historical planning context, but duplicating a full logo table here cannibalizes E1 and muddies the "average CTV CPM" query. If you need a single number for a spreadsheet, use ~$25 as a planning midpoint inside $20-$40, then validate against the platform page and your buyer.
Practical ways to get more from the CPM you pay
Geo first. If you serve one DMA or a store radius, do not pay for national waste.
Start broader than your ego wants, then narrow. Over-narrow targeting inflates CPM before you learn what converts.
Use FAST when volume teaches faster. Tubi and Pluto-style inventory often sit in lower planning bands; see the Tubi hub when that is the job.
Cap frequency. Repeat households without a frequency cap burn budget without new reach.
Measure downstream. Site visits, search lift, and store outcomes matter more than a vanity CPM cell. Pair with CTV advertising benchmarks and CTV targeting options.
If you need the commercial itself, build creative in Wavemaker, then run media buying and reporting in Adwave.
6. Protect creative quality. CPM math cannot rescue a vague spot. Local proof, a clear offer, and an easy next step raise the value of every thousand impressions you buy.
7. Revisit seasonality quarterly. The same targeting ladder that looked expensive in October may clear differently in February. Update the plan instead of freezing last quarter's story.

FAQ
What is the average CTV CPM in 2025-2026?
Planning figures cited on this page put average CTV CPM around $20-$40, with many campaigns near ~$25 (AI Digital) and a median ~$20-$35 band (Keynes Digital). Premium targeting can run higher. Confirm against your buyer; averages are not quotes.
What is a good CTV CPM for a small business?
For broad awareness, ~$20-$25 is often solid value in the bands above. For precise local or intent-heavy buys, ~$30-$45 can still be efficient if waste drops. "Good" means positive unit economics for your offer, not the lowest cell on a blog table.
Why is CTV CPM higher than display or some social ads?
You are paying for full-screen video on the largest screen in the home, usually sound-on, with completion rates the live page frames around 90%+ versus much lower rates for many digital video placements. Attention and brand context are the premium.
How do I calculate impressions from CPM?
Divide budget by CPM, then multiply by 1,000. Example: $500 / $25 x 1,000 = 20,000 impressions. Impressions are not unique households; frequency and flight length change reach.
Will CTV CPMs keep falling?
On-page outlook expects stabilization with more differentiation, not endless free fall: more supply pushes down, while demand, sports, elections, and better targeting push selected inventory up. Plan with bands, revisit quarterly.
Where is the platform-by-platform CPM table?
On the sibling page: TV advertising CPM by platform. This URL stays focused on the average / range answer.
How does ad length affect CPM?
Live-page planning note: 15s near base rates; 30s often about 1.5-2x a 15s rate; 60s (limited) about 2-3x. Most SMB tests use 30-second spots.