Ready in minutes
AI builds your ad from a single prompt

Expert insights and analysis on TV advertising trends and best practices.
insights
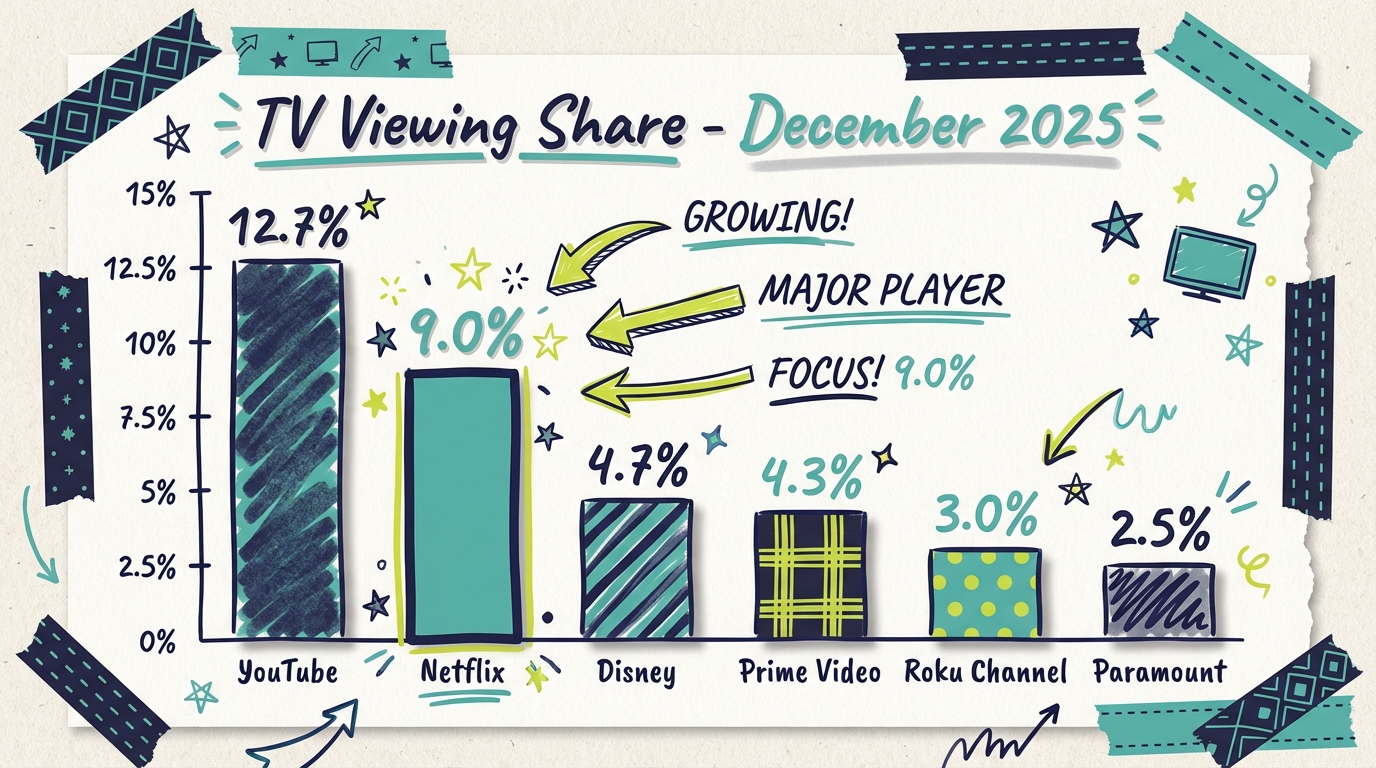
Netflix hit a record 9.0% of total U.S. TV viewing in December 2025, fueled by Stranger Things and NFL games. Full Nielsen data plus how small businesses can now reach Netflix's 70M ad-tier viewers.
insights
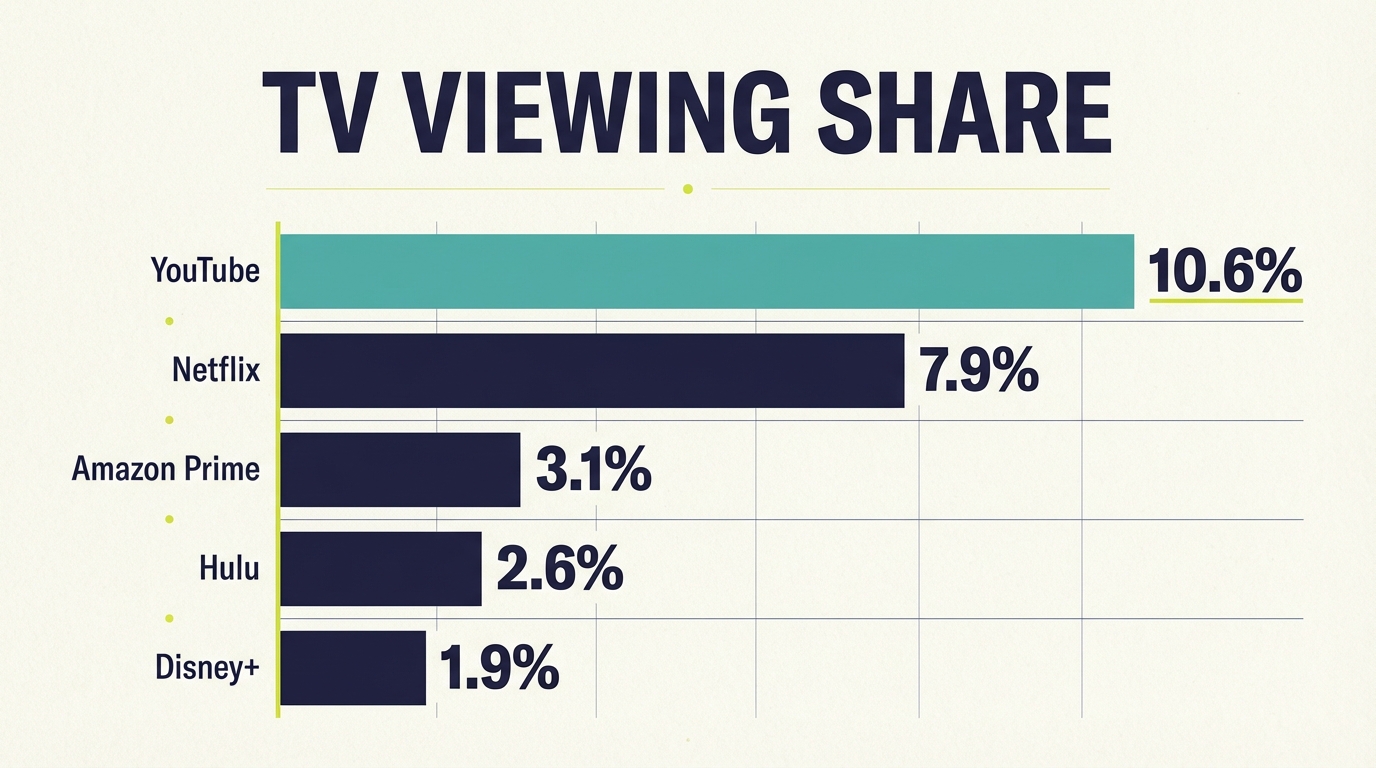
YouTube commands 12.7% of all U.S. TV viewing in Q4 2025, outpacing Netflix and every other streaming platform. Nielsen Gauge data broken down by age, time of day, and what it means for local advertisers.
insights
Amazon Prime Video reaches over 115 million Americans with advertising each month after launching ads in January 2024.
insights
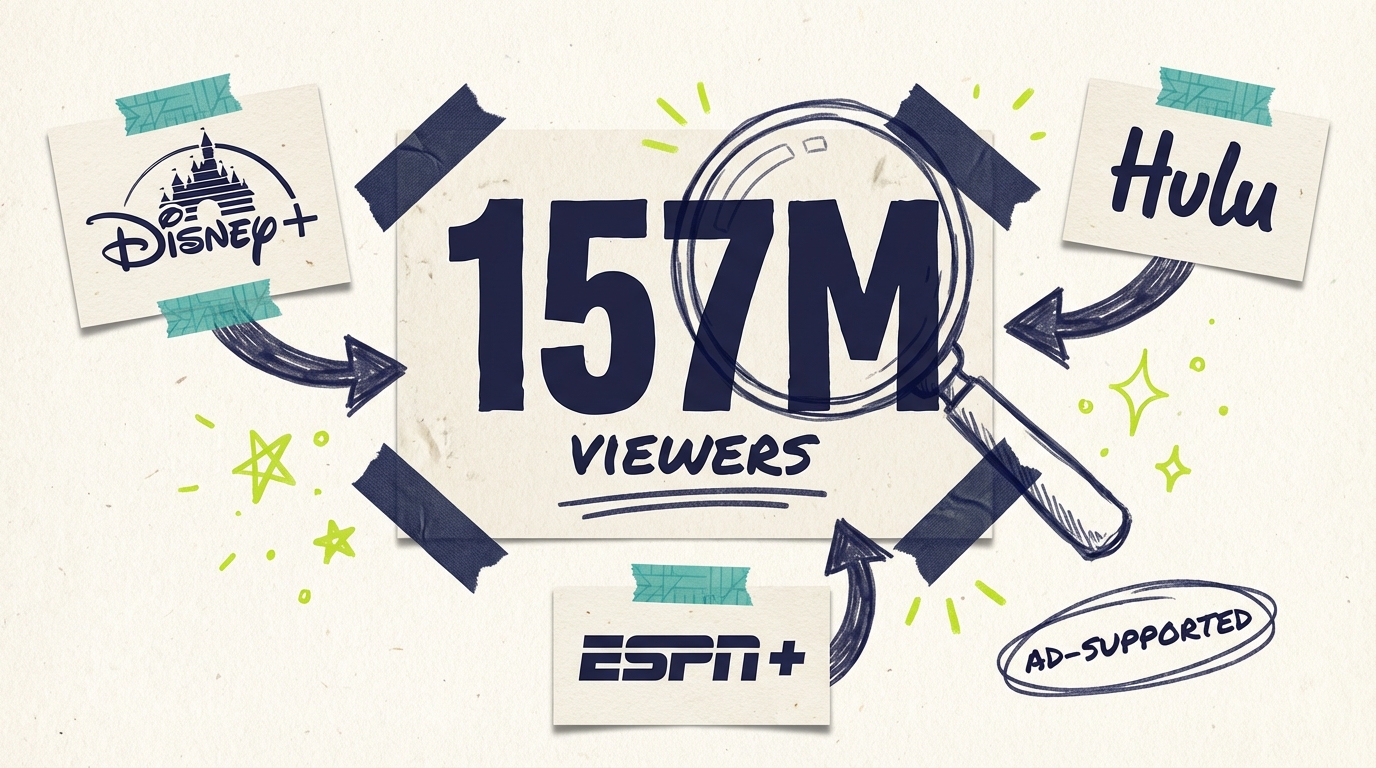
Disney reaches 157 million ad-supported monthly active users across Disney+, Hulu, and ESPN+.

insights
A data-driven look at which advertising channels delivered for small businesses in 2025, from streaming TV's breakthrough to social media's decline, plus lessons for 2026.
insights
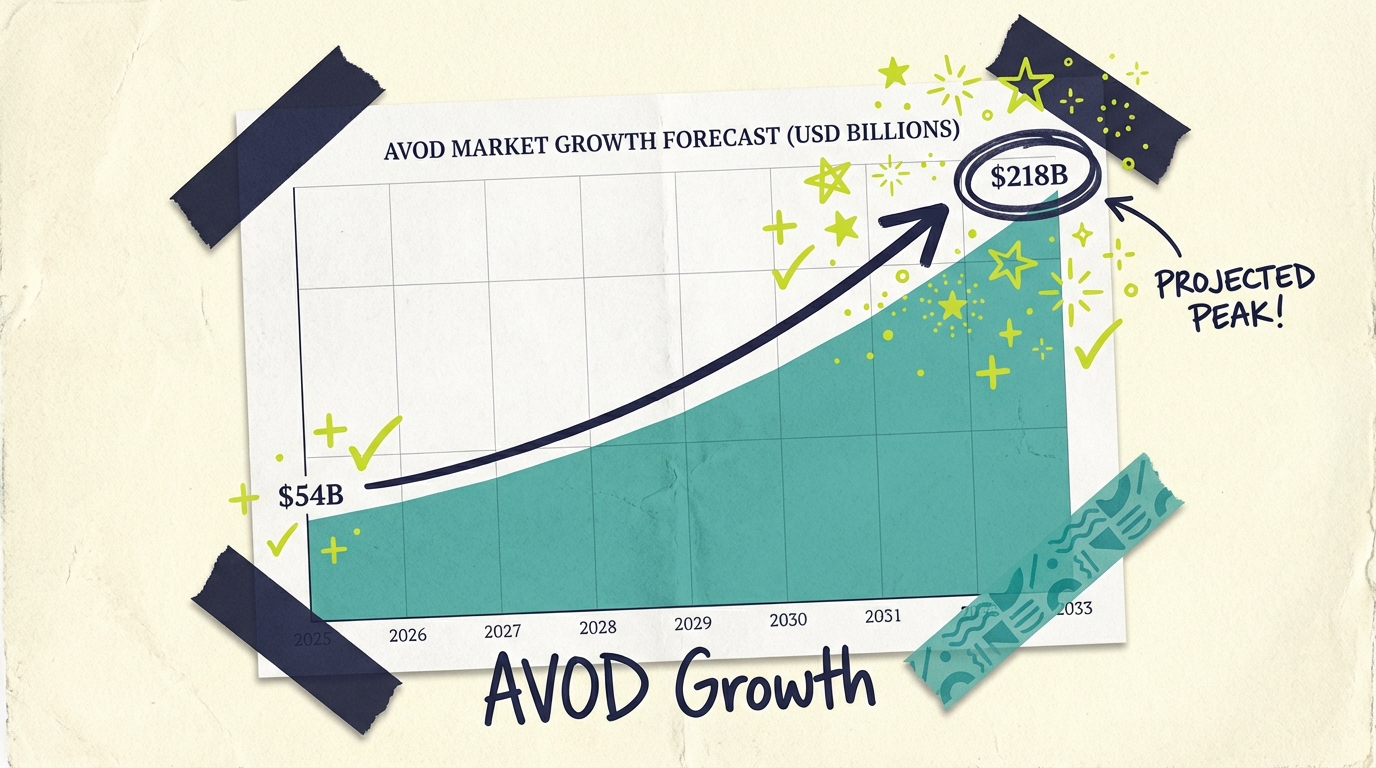
Ad-supported streaming will grow from $54B to $218B globally by 2033. 73% of all TV viewing already occurs on ad-supported platforms.
insights
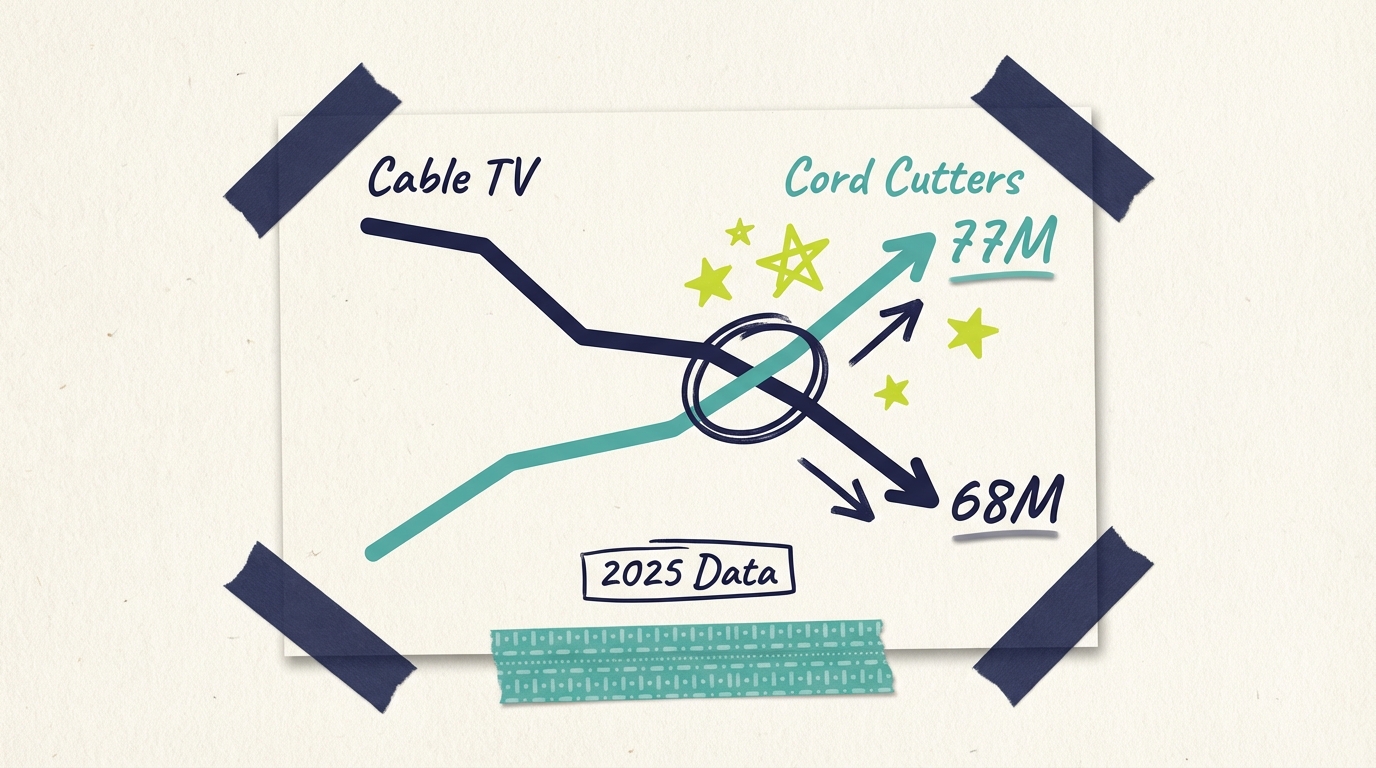
Cord cutting continues despite Q3 2025's surprising subscriber gain. Pay TV lost 5.8% YoY with 77M cord-cutter households now outnumbering cable.
insights
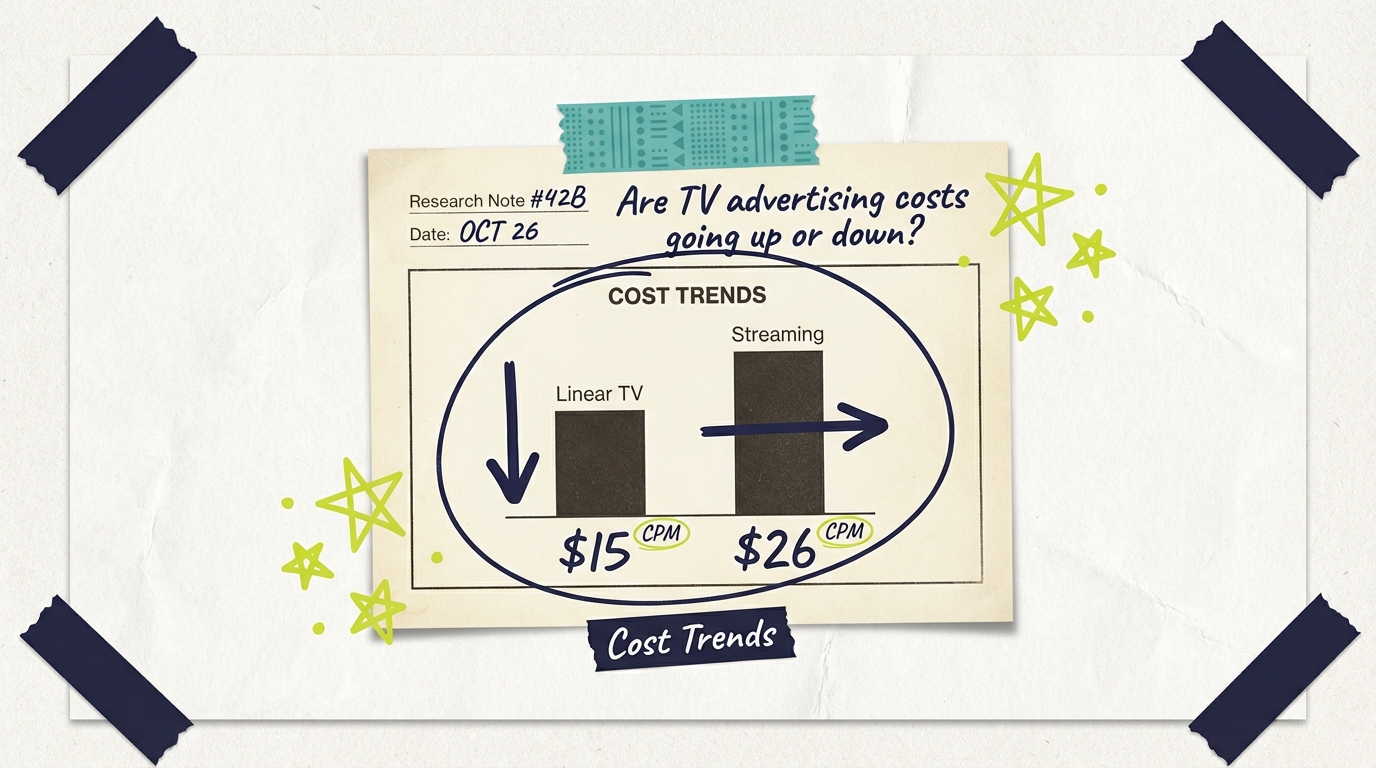
TV advertising costs are diverging: streaming CPMs stable at $26-27 while linear TV faces pricing pressure. See what this means for your advertising budget.
insights
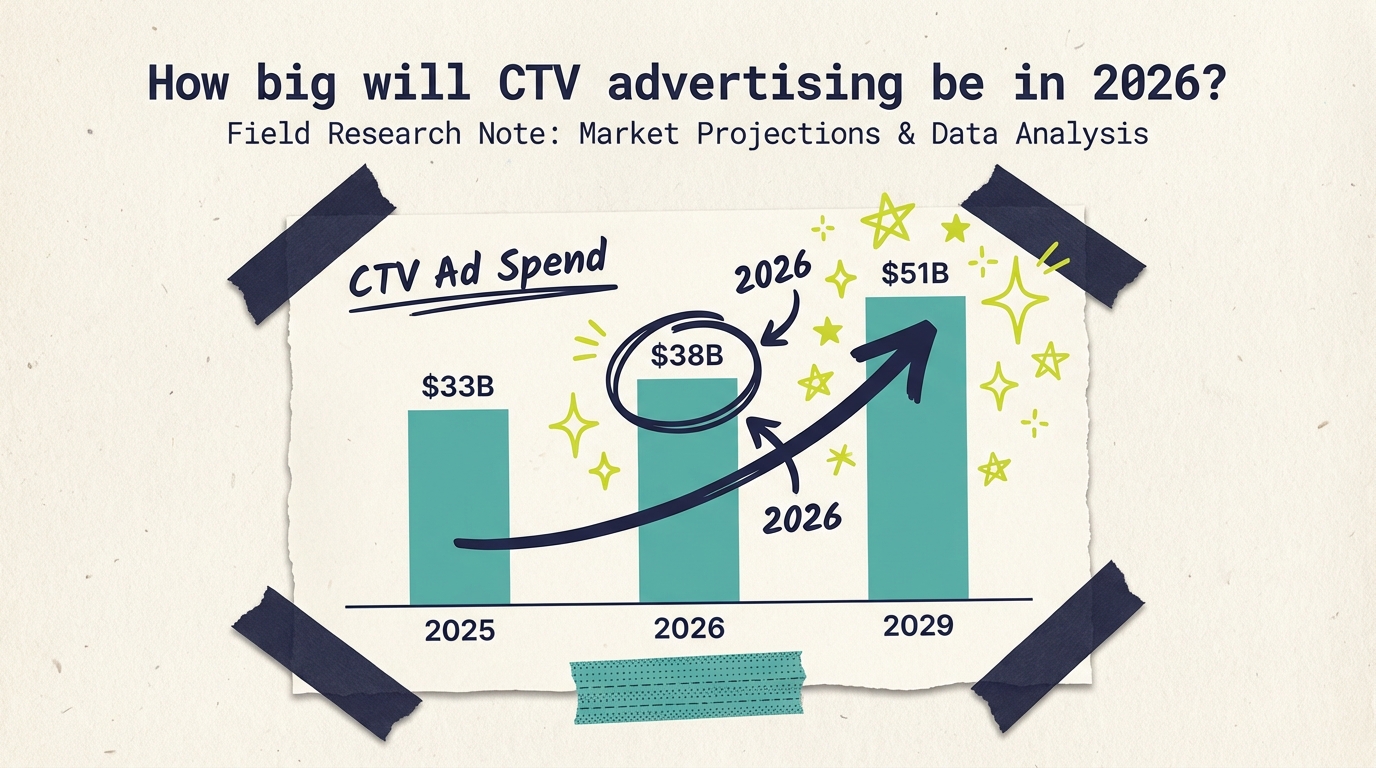
CTV advertising is projected to reach $38 billion in 2026, with 14% growth continuing the channel's dominance. See the full market forecast through 2029.

insights
In Q2 2025, 73.6% of U.S. TV time was ad‑supported, up 1.2 points from Q1. Streaming led the ad‑supported mix.