Ready in minutes
AI builds your ad from a single prompt

Expert insights and analysis on TV advertising trends and best practices.

insights
TV commercial production used to take weeks and cost thousands. AI now handles scripting, visuals, voiceover, and editing in minutes, for free. Here's how it works.

insights
Gen Z watches just 2.1 hours of TV daily, with 43% preferring YouTube and TikTok. Complete breakdown of Gen Z viewing habits and what it means for advertisers.
insights
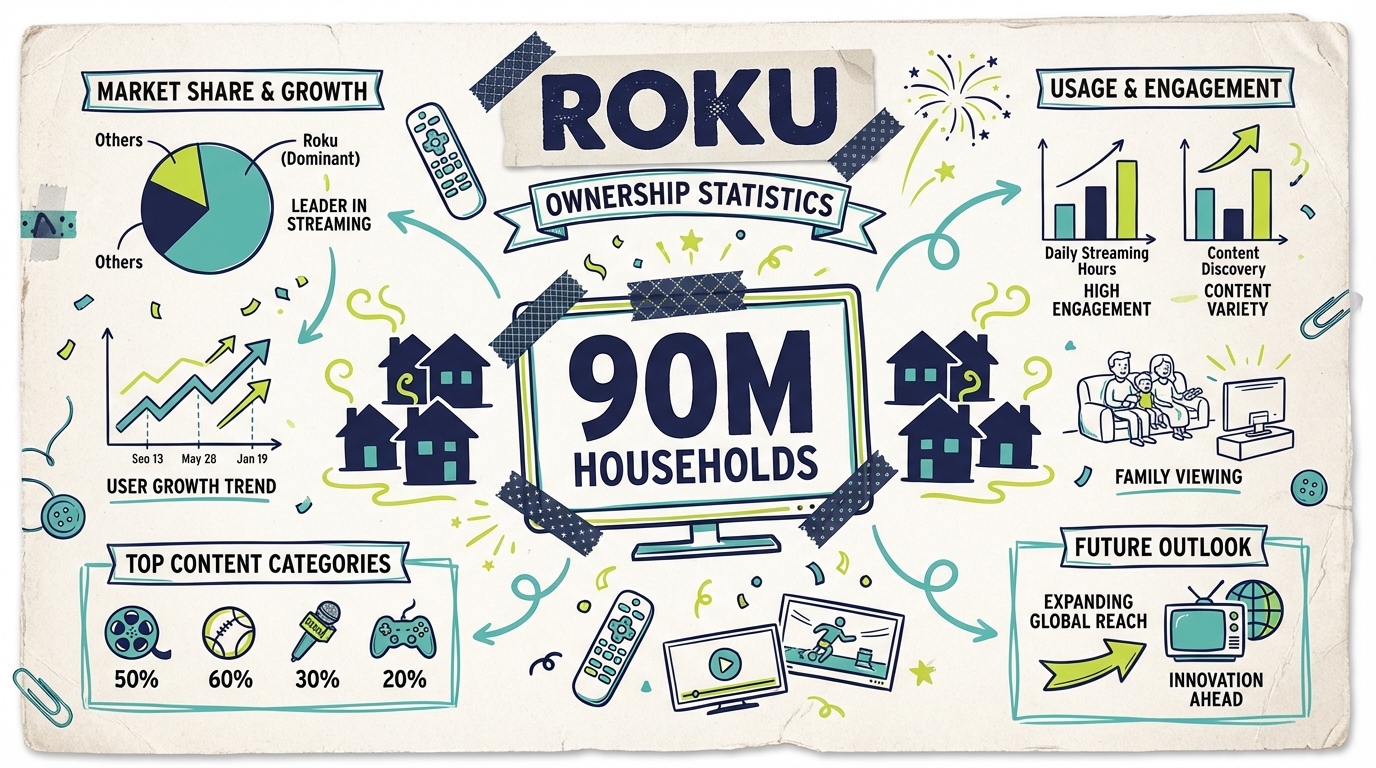
Roku has 90 million streaming households as of January 2025. The #1 selling TV OS in US, Canada, Mexico. Over 50% of US internet households use Roku.
insights
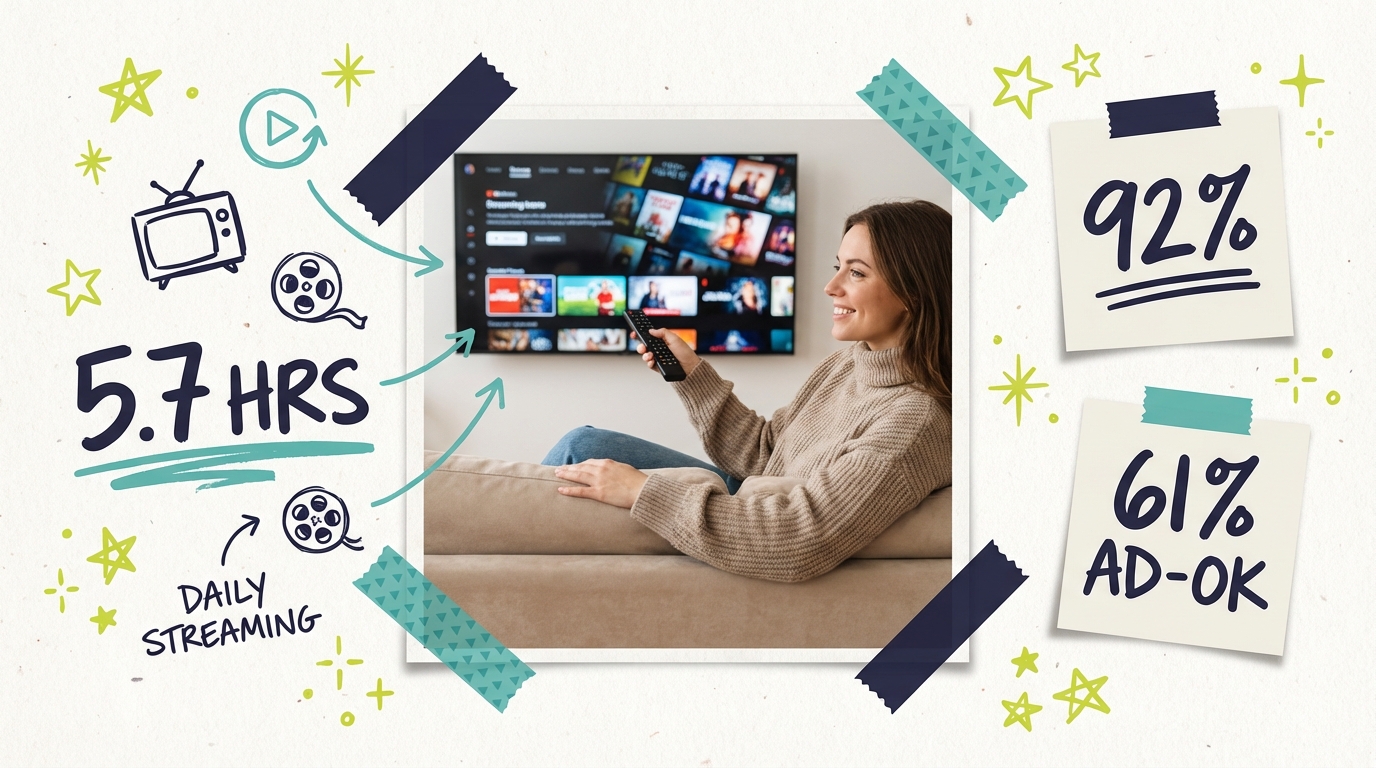
Millennials watch 5.7 hours of streaming daily and 1.5 hours of linear TV. 92% use streaming services. Complete 2025 millennial viewing habits data.
insights
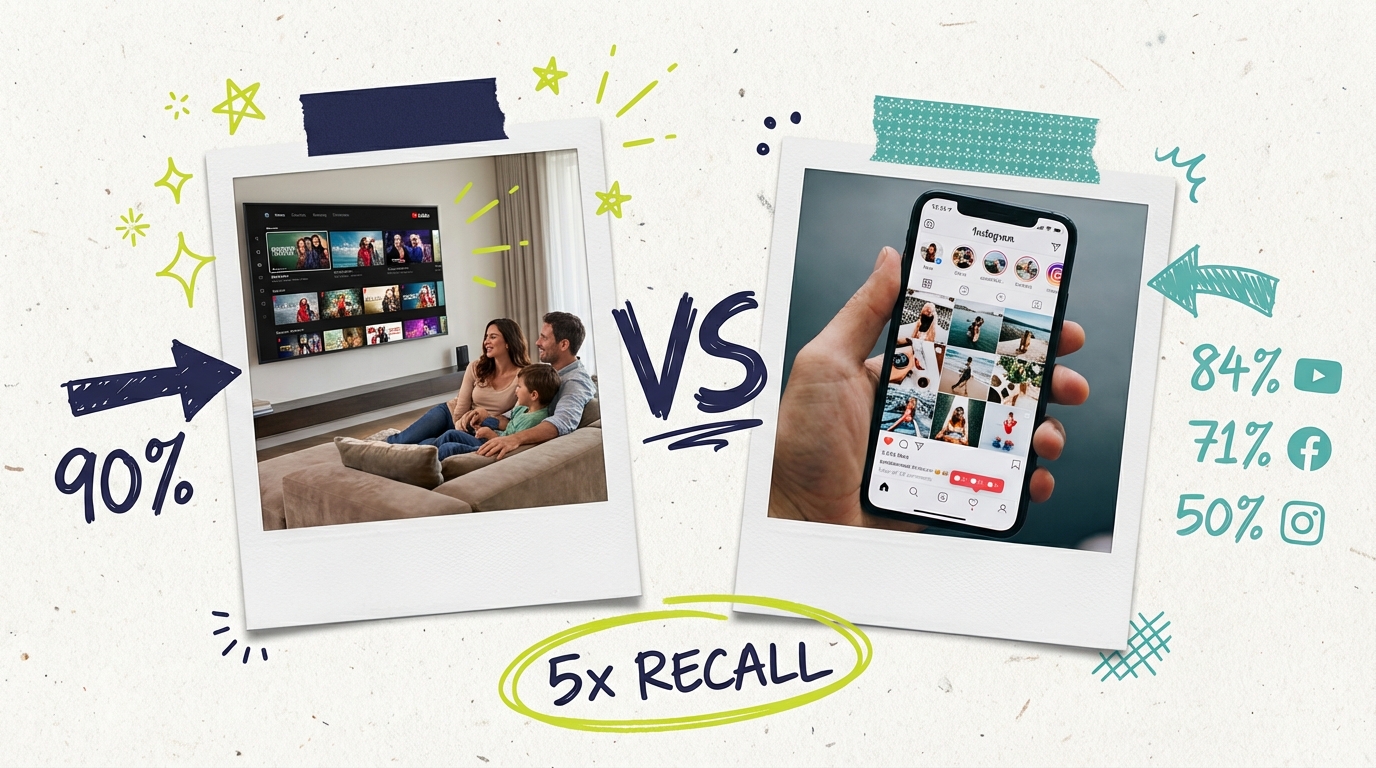
TV advertising reaches 90% of U.S. households with 5x higher brand recall than social-only campaigns. Compare reach, attention, and effectiveness in 2025.
insights
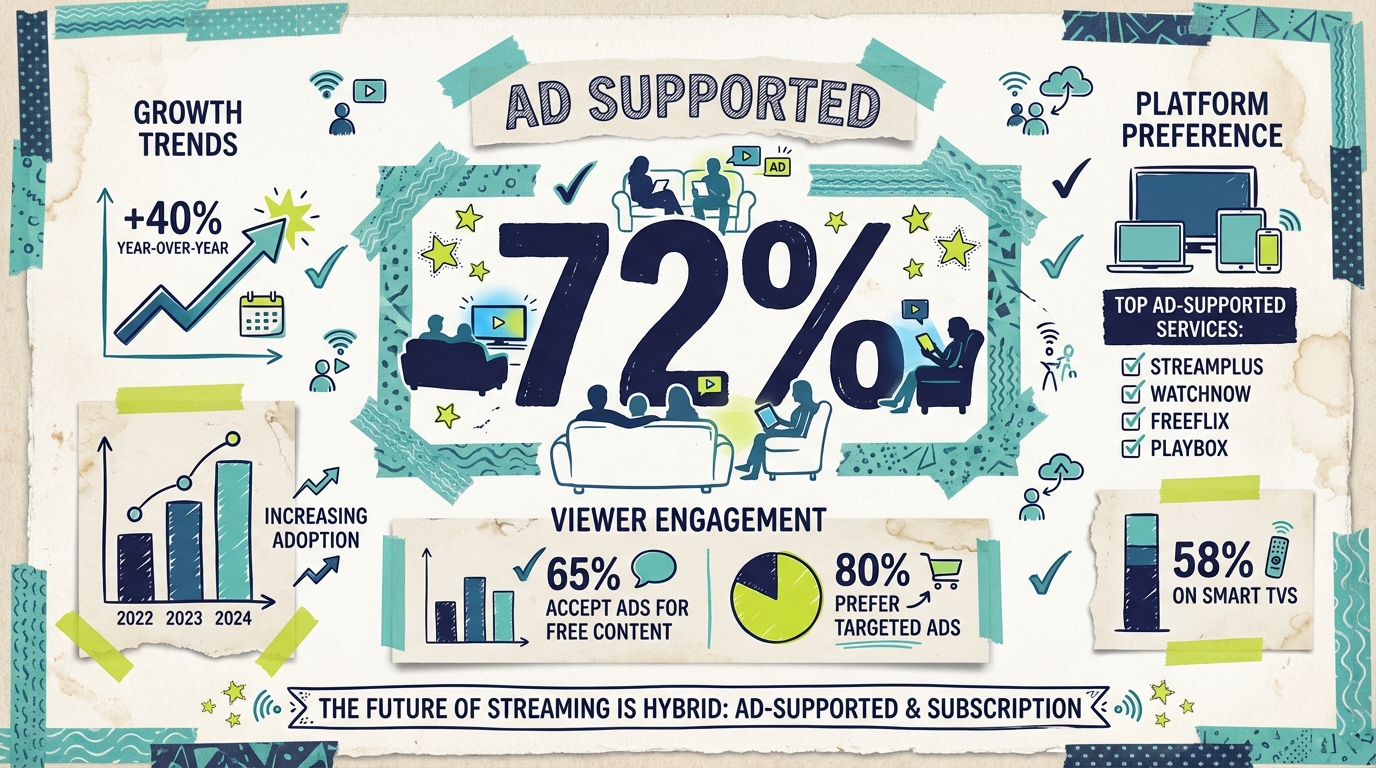
72% of TV viewing time is ad-supported. 83% of U.S. adults watch streaming. Ad-supported viewing grew 43% in 2025.
![How Long Should a TV Commercial Be? [2025 Data]](https://media.adwave.com/fia320z3blxi/3wGAsYnsbANvWE28qWdkjQ/cf187b1497773d246b09cea7fea9ea31/hero.png)
insights
30-second ads achieve 96% completion rates and 24% higher conversions. Compare TV commercial lengths (15, 30, 60 seconds) to find the optimal format for your goals.
![What Is the Average TV Ad CPM by Platform? [Q3 2025]](https://media.adwave.com/fia320z3blxi/38K3bqHcP4qtJRVOpQ53Zp/fe6745f0e25df8409acb998779e3f7b3/hero.png)
insights
Netflix CPM: $37. Pluto TV: $15. See 2024 streaming TV advertising CPM rates for every major platform and learn how to optimize your ad spend.
![How Effective Is TV Advertising vs Digital? [Q3 2025]](https://media.adwave.com/fia320z3blxi/5tZqzDcIpw5v1EQEpGZUb2/3729488d64e78b3fd37a70bd5d27346a/hero.png)
insights
TV advertising delivers 39% higher brand recall and $7 ROI per $1 spent. Learn how TV and digital compare on effectiveness metrics and when to use each.
![What Is the Average TV Ad Completion Rate? [Q3 2025]](https://media.adwave.com/fia320z3blxi/6KsnXayjmvhhezY6AFZQgR/5f2f350e9feee72227a3b8d8da3f0b91/hero.png)
insights
CTV ads achieve 95%+ completion rates compared to 80% on mobile. Learn what drives these differences and how to maximize your video ad performance.